

NEW: Annual Report - George Mason University
NEW: Annual Report - George Mason University
NEW: Annual Report - George Mason University

Create successful ePaper yourself
Turn your PDF publications into a flip-book with our unique Google optimized e-Paper software.
90<br />
PBmax (ug C/ug Chl a/hr)<br />
30<br />
25<br />
20<br />
15<br />
10<br />
5<br />
Station 7: June-Sept<br />
1980 1985 1990 1995 2000 2005<br />
YEAR<br />
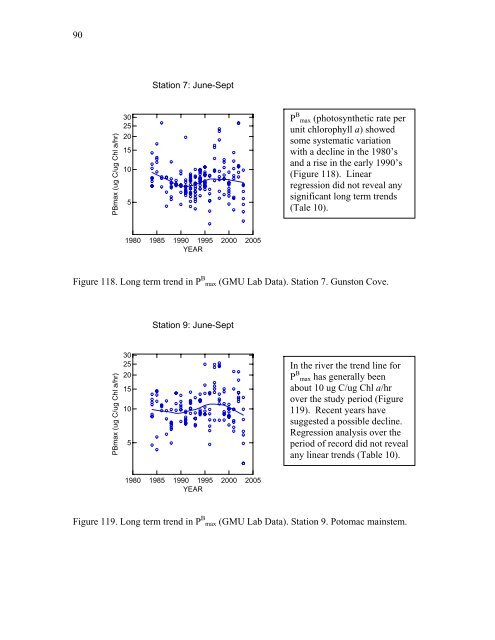
P B max (photosynthetic rate per<br />
unit chlorophyll a) showed<br />
some systematic variation<br />
with a decline in the 1980’s<br />
and a rise in the early 1990’s<br />
(Figure 118). Linear<br />
regression did not reveal any<br />
significant long term trends<br />
(Tale 10).<br />
Figure 118. Long term trend in P B max (GMU Lab Data). Station 7. Gunston Cove.<br />
PBmax (ug C/ug Chl a/hr)<br />
30<br />
25<br />
20<br />
15<br />
10<br />
5<br />
Station 9: June-Sept<br />
1980 1985 1990 1995 2000 2005<br />
YEAR<br />
In the river the trend line for<br />
P B max has generally been<br />
about 10 ug C/ug Chl a/hr<br />
over the study period (Figure<br />
119). Recent years have<br />
suggested a possible decline.<br />
Regression analysis over the<br />
period of record did not reveal<br />
any linear trends (Table 10).<br />
Figure 119. Long term trend in P B max (GMU Lab Data). Station 9. Potomac mainstem.


