

NEW: Annual Report - George Mason University
NEW: Annual Report - George Mason University
NEW: Annual Report - George Mason University

Create successful ePaper yourself
Turn your PDF publications into a flip-book with our unique Google optimized e-Paper software.
Photosynthetic Rate (mgC/L/hr)<br />
600<br />
500<br />
400<br />
300<br />
200<br />
100<br />
Gunston Cove Study - 2003<br />
Station 7<br />
Station 9<br />
0<br />
Mar Apr May Jun Jul Aug Sep Oct Nov Dec Jan<br />
27<br />
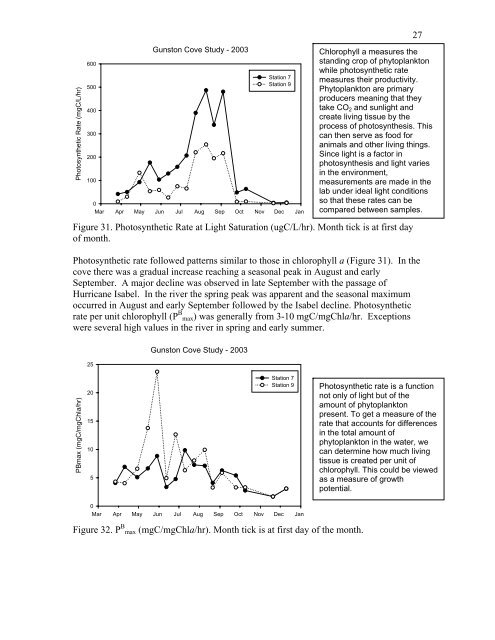
Chlorophyll a measures the<br />
standing crop of phytoplankton<br />
while photosynthetic rate<br />
measures their productivity.<br />
Phytoplankton are primary<br />
producers meaning that they<br />
take CO2 and sunlight and<br />
create living tissue by the<br />
process of photosynthesis. This<br />
can then serve as food for<br />
animals and other living things.<br />
Since light is a factor in<br />
photosynthesis and light varies<br />
in the environment,<br />
measurements are made in the<br />
lab under ideal light conditions<br />
so that these rates can be<br />
compared between samples.<br />
Figure 31. Photosynthetic Rate at Light Saturation (ugC/L/hr). Month tick is at first day<br />
of month.<br />
Photosynthetic rate followed patterns similar to those in chlorophyll a (Figure 31). In the<br />
cove there was a gradual increase reaching a seasonal peak in August and early<br />
September. A major decline was observed in late September with the passage of<br />
Hurricane Isabel. In the river the spring peak was apparent and the seasonal maximum<br />
occurred in August and early September followed by the Isabel decline. Photosynthetic<br />
rate per unit chlorophyll (P B max) was generally from 3-10 mgC/mgChla/hr. Exceptions<br />
were several high values in the river in spring and early summer.<br />
PBmax (mgC/mgChla/hr)<br />
25<br />
20<br />
15<br />
10<br />
5<br />
Gunston Cove Study - 2003<br />
Station 7<br />
Station 9<br />
0<br />
Mar Apr May Jun Jul Aug Sep Oct Nov Dec Jan<br />
Figure 32. P B max (mgC/mgChla/hr). Month tick is at first day of the month.<br />
Photosynthetic rate is a function<br />
not only of light but of the<br />
amount of phytoplankton<br />
present. To get a measure of the<br />
rate that accounts for differences<br />
in the total amount of<br />
phytoplankton in the water, we<br />
can determine how much living<br />
tissue is created per unit of<br />
chlorophyll. This could be viewed<br />
as a measure of growth<br />
potential.


