

NEW: Annual Report - George Mason University
NEW: Annual Report - George Mason University
NEW: Annual Report - George Mason University

Create successful ePaper yourself
Turn your PDF publications into a flip-book with our unique Google optimized e-Paper software.
Lab pH, Noman Cole Lab<br />
11<br />
10<br />
9<br />
8<br />
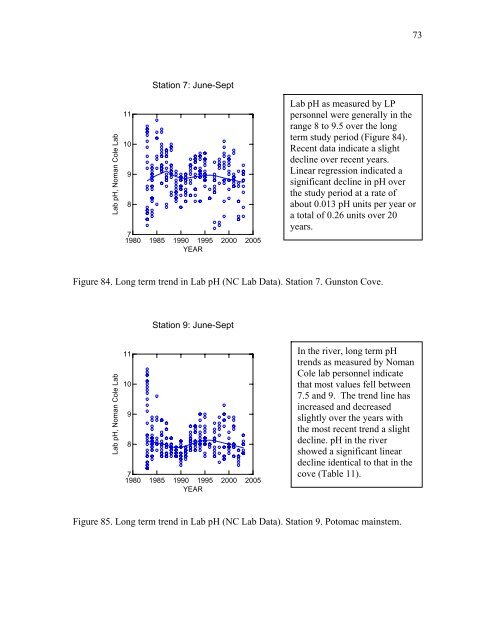
Station 7: June-Sept<br />
7<br />
1980 1985 1990 1995 2000 2005<br />
YEAR<br />
73<br />
Lab pH as measured by LP<br />
personnel were generally in the<br />
range 8 to 9.5 over the long<br />
term study period (Figure 84).<br />
Recent data indicate a slight<br />
decline over recent years.<br />
Linear regression indicated a<br />
significant decline in pH over<br />
the study period at a rate of<br />
about 0.013 pH units per year or<br />
a total of 0.26 units over 20<br />
years.<br />
Figure 84. Long term trend in Lab pH (NC Lab Data). Station 7. Gunston Cove.<br />
Lab pH, Noman Cole Lab<br />
11<br />
10<br />
9<br />
8<br />
Station 9: June-Sept<br />
7<br />
1980 1985 1990 1995 2000 2005<br />
YEAR<br />
In the river, long term pH<br />
trends as measured by Noman<br />
Cole lab personnel indicate<br />
that most values fell between<br />
7.5 and 9. The trend line has<br />
increased and decreased<br />
slightly over the years with<br />
the most recent trend a slight<br />
decline. pH in the river<br />
showed a significant linear<br />
decline identical to that in the<br />
cove (Table 11).<br />
Figure 85. Long term trend in Lab pH (NC Lab Data). Station 9. Potomac mainstem.


