

NEW: Annual Report - George Mason University
NEW: Annual Report - George Mason University
NEW: Annual Report - George Mason University

You also want an ePaper? Increase the reach of your titles
YUMPU automatically turns print PDFs into web optimized ePapers that Google loves.
Secchi Disk Depth (cm)<br />
90<br />
80<br />
70<br />
60<br />
50<br />
40<br />
30<br />
20<br />
Station 7: June-Sept<br />
1980 1985 1990 1995 2000 2005<br />
YEAR<br />
69<br />
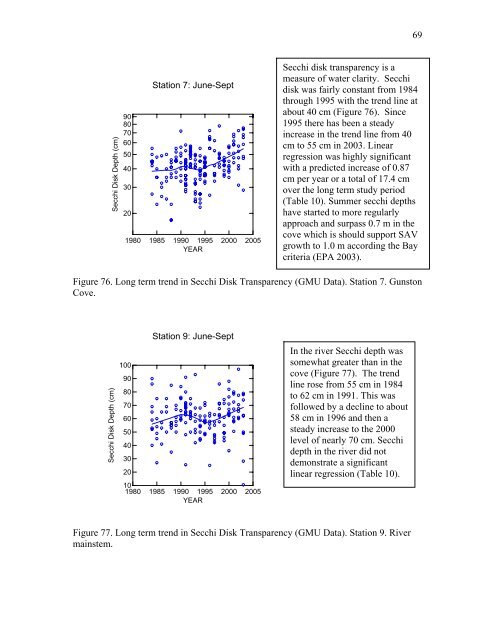
Secchi disk transparency is a<br />
measure of water clarity. Secchi<br />
disk was fairly constant from 1984<br />
through 1995 with the trend line at<br />
about 40 cm (Figure 76). Since<br />
1995 there has been a steady<br />
increase in the trend line from 40<br />
cm to 55 cm in 2003. Linear<br />
regression was highly significant<br />
with a predicted increase of 0.87<br />
cm per year or a total of 17.4 cm<br />
over the long term study period<br />
(Table 10). Summer secchi depths<br />
have started to more regularly<br />
approach and surpass 0.7 m in the<br />
cove which is should support SAV<br />
growth to 1.0 m according the Bay<br />
criteria (EPA 2003).<br />
Figure 76. Long term trend in Secchi Disk Transparency (GMU Data). Station 7. Gunston<br />
Cove.<br />
Secchi Disk Depth (cm)<br />
100<br />
90<br />
80<br />
70<br />
60<br />
50<br />
40<br />
30<br />
20<br />
Station 9: June-Sept<br />
10<br />
1980 1985 1990 1995 2000 2005<br />
YEAR<br />
In the river Secchi depth was<br />
somewhat greater than in the<br />
cove (Figure 77). The trend<br />
line rose from 55 cm in 1984<br />
to 62 cm in 1991. This was<br />
followed by a decline to about<br />
58 cm in 1996 and then a<br />
steady increase to the 2000<br />
level of nearly 70 cm. Secchi<br />
depth in the river did not<br />
demonstrate a significant<br />
linear regression (Table 10).<br />
Figure 77. Long term trend in Secchi Disk Transparency (GMU Data). Station 9. River<br />
mainstem.


