

NEW: Annual Report - George Mason University
NEW: Annual Report - George Mason University
NEW: Annual Report - George Mason University

You also want an ePaper? Increase the reach of your titles
YUMPU automatically turns print PDFs into web optimized ePapers that Google loves.
24<br />
N/P Ratio (by mass)<br />
60<br />
50<br />
40<br />
30<br />
20<br />
10<br />
Station 7<br />
Station 9<br />
Gunston Cove Study - 2003<br />
0<br />
Mar Apr May Jun Jul Aug Sep Oct Nov Dec Jan<br />
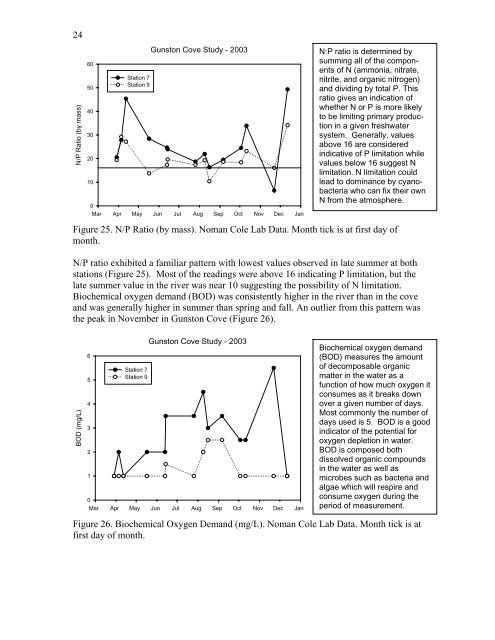
N:P ratio is determined by<br />
summing all of the components<br />
of N (ammonia, nitrate,<br />
nitrite, and organic nitrogen)<br />
and dividing by total P. This<br />
ratio gives an indication of<br />
whether N or P is more likely<br />
to be limiting primary production<br />
in a given freshwater<br />
system. Generally, values<br />
above 16 are considered<br />
indicative of P limitation while<br />
values below 16 suggest N<br />
limitation. N limitation could<br />
lead to dominance by cyanobacteria<br />
who can fix their own<br />
N from the atmosphere.<br />
Figure 25. N/P Ratio (by mass). Noman Cole Lab Data. Month tick is at first day of<br />
month.<br />
N/P ratio exhibited a familiar pattern with lowest values observed in late summer at both<br />
stations (Figure 25). Most of the readings were above 16 indicating P limitation, but the<br />
late summer value in the river was near 10 suggesting the possibility of N limitation.<br />
Biochemical oxygen demand (BOD) was consistently higher in the river than in the cove<br />
and was generally higher in summer than spring and fall. An outlier from this pattern was<br />
the peak in November in Gunston Cove (Figure 26).<br />
BOD (mg/L)<br />
6<br />
5<br />
4<br />
3<br />
2<br />
1<br />
Station 7<br />
Station 9<br />
Gunston Cove Study - 2003<br />
0<br />
Mar Apr May Jun Jul Aug Sep Oct Nov Dec Jan<br />
Biochemical oxygen demand<br />
(BOD) measures the amount<br />
of decomposable organic<br />
matter in the water as a<br />
function of how much oxygen it<br />
consumes as it breaks down<br />
over a given number of days.<br />
Most commonly the number of<br />
days used is 5. BOD is a good<br />
indicator of the potential for<br />
oxygen depletion in water.<br />
BOD is composed both<br />
dissolved organic compounds<br />
in the water as well as<br />
microbes such as bacteria and<br />
algae which will respire and<br />
consume oxygen during the<br />
period of measurement.<br />
Figure 26. Biochemical Oxygen Demand (mg/L). Noman Cole Lab Data. Month tick is at<br />
first day of month.


