

NEW: Annual Report - George Mason University
NEW: Annual Report - George Mason University
NEW: Annual Report - George Mason University

Create successful ePaper yourself
Turn your PDF publications into a flip-book with our unique Google optimized e-Paper software.
Leptodora (#/m3)<br />
10000.0<br />
1000.0<br />
100.0<br />
10.0<br />
Station 7: All Months<br />
1.0<br />
1985 1990 1995<br />
YEAR<br />
2000 2005<br />
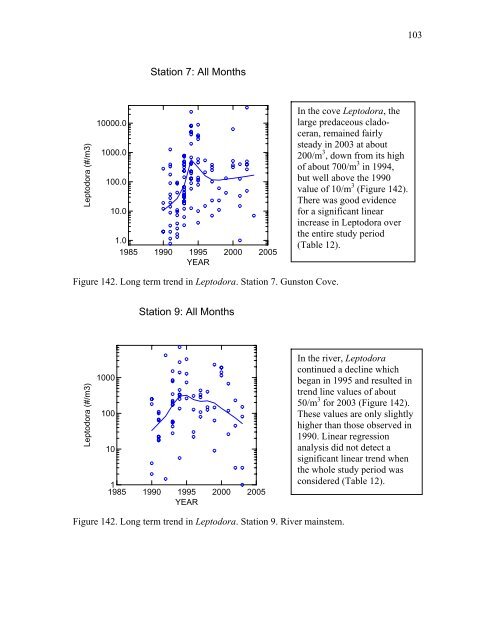
Figure 142. Long term trend in Leptodora. Station 7. Gunston Cove.<br />
Leptodora (#/m3)<br />
1000<br />
100<br />
10<br />
Station 9: All Months<br />
1<br />
1985 1990 1995<br />
YEAR<br />
2000 2005<br />
Figure 142. Long term trend in Leptodora. Station 9. River mainstem.<br />
In the cove Leptodora, the<br />
large predaceous cladoceran,<br />
remained fairly<br />
steady in 2003 at about<br />
200/m 3 , down from its high<br />
of about 700/m 3 in 1994,<br />
but well above the 1990<br />
value of 10/m 3 (Figure 142).<br />
There was good evidence<br />
for a significant linear<br />
increase in Leptodora over<br />
the entire study period<br />
(Table 12).<br />
In the river, Leptodora<br />
continued a decline which<br />
began in 1995 and resulted in<br />
trend line values of about<br />
50/m 3 for 2003 (Figure 142).<br />
These values are only slightly<br />
higher than those observed in<br />
1990. Linear regression<br />
analysis did not detect a<br />
significant linear trend when<br />
the whole study period was<br />
considered (Table 12).<br />
103


