

NEW: Annual Report - George Mason University
NEW: Annual Report - George Mason University
NEW: Annual Report - George Mason University

Create successful ePaper yourself
Turn your PDF publications into a flip-book with our unique Google optimized e-Paper software.
Mean Catch Per Trawl<br />
250<br />
200<br />
150<br />
100<br />
50<br />
All Species<br />
White Perch<br />
Trawl Stations 7 and 10<br />
All Species and White Perch<br />
0<br />
1984 1986 1988 1990 1992 1994 1996 1998 2000 2002 2004<br />
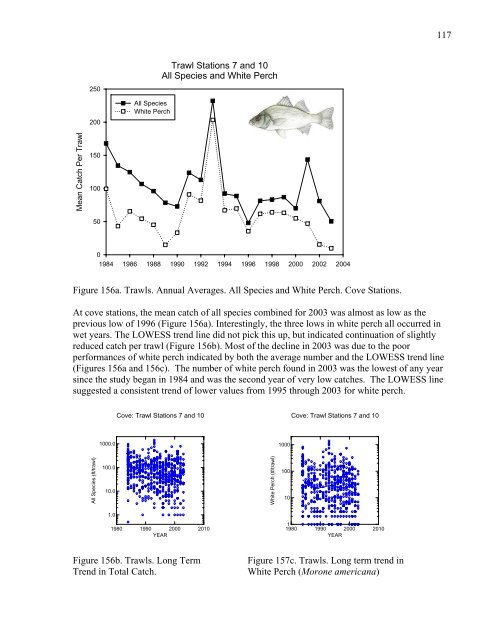
Figure 156a. Trawls. <strong>Annual</strong> Averages. All Species and White Perch. Cove Stations.<br />
At cove stations, the mean catch of all species combined for 2003 was almost as low as the<br />
previous low of 1996 (Figure 156a). Interestingly, the three lows in white perch all occurred in<br />
wet years. The LOWESS trend line did not pick this up, but indicated continuation of slightly<br />
reduced catch per trawl (Figure 156b). Most of the decline in 2003 was due to the poor<br />
performances of white perch indicated by both the average number and the LOWESS trend line<br />
(Figures 156a and 156c). The number of white perch found in 2003 was the lowest of any year<br />
since the study began in 1984 and was the second year of very low catches. The LOWESS line<br />
suggested a consistent trend of lower values from 1995 through 2003 for white perch.<br />
All Species (#/trawl)<br />
1000.0<br />
100.0<br />
10.0<br />
1.0<br />
Cove: Trawl Stations 7 and 10<br />
1980 1990 2000 2010<br />
YEAR<br />
Cove: Trawl Stations 7 and 10<br />
1<br />
1980 1990 2000 2010<br />
YEAR<br />
Figure 156b. Trawls. Long Term Figure 157c. Trawls. Long term trend in<br />
Trend in Total Catch. White Perch (Morone americana)<br />
White Perch (#/trawl)<br />
1000<br />
100<br />
10<br />
117


