

NEW: Annual Report - George Mason University
NEW: Annual Report - George Mason University
NEW: Annual Report - George Mason University

Create successful ePaper yourself
Turn your PDF publications into a flip-book with our unique Google optimized e-Paper software.
Photosynthetic Rate (mg C/L/hr)<br />
1000<br />
100<br />
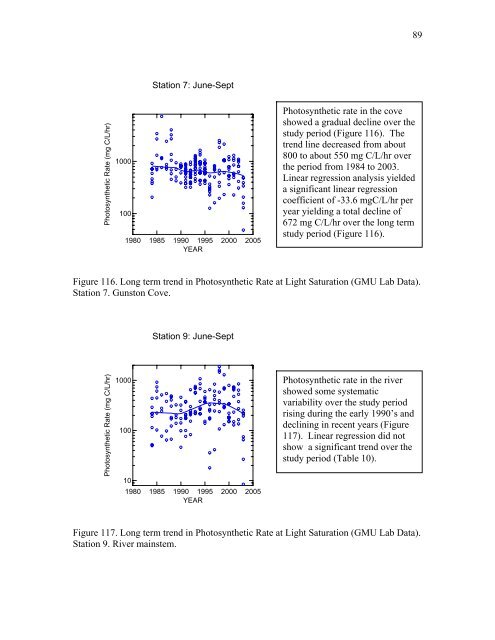
Station 7: June-Sept<br />
1980 1985 1990 1995 2000 2005<br />
YEAR<br />
Photosynthetic rate in the cove<br />
showed a gradual decline over the<br />
study period (Figure 116). The<br />
trend line decreased from about<br />
800 to about 550 mg C/L/hr over<br />
the period from 1984 to 2003.<br />
Linear regression analysis yielded<br />
a significant linear regression<br />
coefficient of -33.6 mgC/L/hr per<br />
year yielding a total decline of<br />
672 mg C/L/hr over the long term<br />
study period (Figure 116).<br />
Figure 116. Long term trend in Photosynthetic Rate at Light Saturation (GMU Lab Data).<br />
Station 7. Gunston Cove.<br />
Photosynthetic Rate (mg C/L/hr)<br />
1000<br />
100<br />
10<br />
Station 9: June-Sept<br />
1980 1985 1990 1995 2000 2005<br />
YEAR<br />
Photosynthetic rate in the river<br />
showed some systematic<br />
variability over the study period<br />
rising during the early 1990’s and<br />
declining in recent years (Figure<br />
117). Linear regression did not<br />
show a significant trend over the<br />
study period (Table 10).<br />
Figure 117. Long term trend in Photosynthetic Rate at Light Saturation (GMU Lab Data).<br />
Station 9. River mainstem.<br />
89


