

NEW: Annual Report - George Mason University
NEW: Annual Report - George Mason University
NEW: Annual Report - George Mason University

Create successful ePaper yourself
Turn your PDF publications into a flip-book with our unique Google optimized e-Paper software.
26<br />
C. Phytoplankton<br />
Chlorophyll a, Depth-integrated (ug/L)<br />
100<br />
80<br />
60<br />
40<br />
20<br />
Gunston Cove Study - 2003<br />
Station 7<br />
Station 9<br />
0<br />
Mar Apr May Jun Jul Aug Sep Oct Nov Dec Jan<br />
Chlorophyll a is a measure of<br />
the amount of algae growing in<br />
the water column. These<br />
suspended algae are called<br />
phytoplankton, meaning “plant<br />
wanderers”. In addition to the<br />
true algae (greens, diatoms,<br />
cryptophytes, etc.) the term<br />
phytoplankton includes<br />
cyanobacteria (sometimes<br />
known as “blue-green” algae.<br />
Both depth-integrated and<br />
surface chlorophyll values are<br />
measured due to the capacity<br />
of phytoplankton to aggregate<br />
near the surface under certain<br />
conditions.<br />
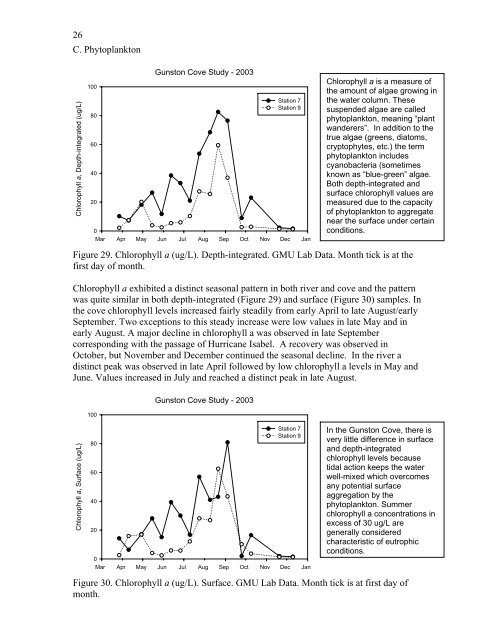
Figure 29. Chlorophyll a (ug/L). Depth-integrated. GMU Lab Data. Month tick is at the<br />
first day of month.<br />
Chlorophyll a exhibited a distinct seasonal pattern in both river and cove and the pattern<br />
was quite similar in both depth-integrated (Figure 29) and surface (Figure 30) samples. In<br />
the cove chlorophyll levels increased fairly steadily from early April to late August/early<br />
September. Two exceptions to this steady increase were low values in late May and in<br />
early August. A major decline in chlorophyll a was observed in late September<br />
corresponding with the passage of Hurricane Isabel. A recovery was observed in<br />
October, but November and December continued the seasonal decline. In the river a<br />
distinct peak was observed in late April followed by low chlorophyll a levels in May and<br />
June. Values increased in July and reached a distinct peak in late August.<br />
Chlorophyll a, Surface (ug/L)<br />
100<br />
80<br />
60<br />
40<br />
20<br />
Gunston Cove Study - 2003<br />
Station 7<br />
Station 9<br />
0<br />
Mar Apr May Jun Jul Aug Sep Oct Nov Dec Jan<br />
In the Gunston Cove, there is<br />
very little difference in surface<br />
and depth-integrated<br />
chlorophyll levels because<br />
tidal action keeps the water<br />
well-mixed which overcomes<br />
any potential surface<br />
aggregation by the<br />
phytoplankton. Summer<br />
chlorophyll a concentrations in<br />
excess of 30 ug/L are<br />
generally considered<br />
characteristic of eutrophic<br />
conditions.<br />
Figure 30. Chlorophyll a (ug/L). Surface. GMU Lab Data. Month tick is at first day of<br />
month.


