

NEW: Annual Report - George Mason University
NEW: Annual Report - George Mason University
NEW: Annual Report - George Mason University

Create successful ePaper yourself
Turn your PDF publications into a flip-book with our unique Google optimized e-Paper software.
Mean Catch Per Seine<br />
100<br />
80<br />
60<br />
40<br />
20<br />
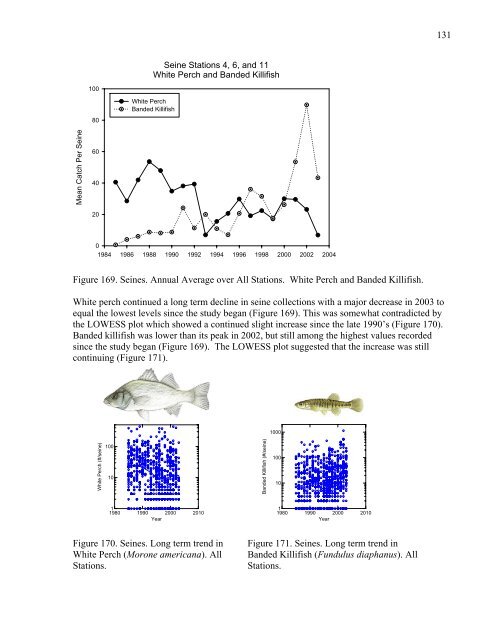
Seine Stations 4, 6, and 11<br />
White Perch and Banded Killifish<br />
White Perch<br />
Banded Killifish<br />
0<br />
1984 1986 1988 1990 1992 1994 1996 1998 2000 2002 2004<br />
Figure 169. Seines. <strong>Annual</strong> Average over All Stations. White Perch and Banded Killifish.<br />
White perch continued a long term decline in seine collections with a major decrease in 2003 to<br />
equal the lowest levels since the study began (Figure 169). This was somewhat contradicted by<br />
the LOWESS plot which showed a continued slight increase since the late 1990’s (Figure 170).<br />
Banded killifish was lower than its peak in 2002, but still among the highest values recorded<br />
since the study began (Figure 169). The LOWESS plot suggested that the increase was still<br />
continuing (Figure 171).<br />
White Perch (#/seine)<br />
100<br />
10<br />
Seines: All Stations<br />
1<br />
1980 1990 2000 2010<br />
Year<br />
Seines: All Stations<br />
1<br />
1980 1990 2000 2010<br />
Year<br />
Figure 170. Seines. Long term trend in Figure 171. Seines. Long term trend in<br />
White Perch (Morone americana). All Banded Killifish (Fundulus diaphanus). All<br />
Stations. Stations.<br />
Banded Killifish (#/seine)<br />
1000<br />
100<br />
10<br />
131


