

NEW: Annual Report - George Mason University
NEW: Annual Report - George Mason University
NEW: Annual Report - George Mason University

Create successful ePaper yourself
Turn your PDF publications into a flip-book with our unique Google optimized e-Paper software.
Total Suspended Solids (mg/L)<br />
160<br />
140<br />
120<br />
100<br />
80<br />
60<br />
40<br />
20<br />
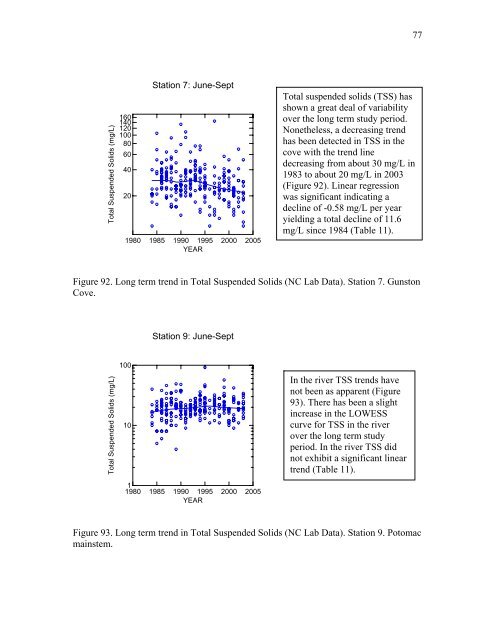
Station 7: June-Sept<br />
1980 1985 1990 1995 2000 2005<br />
YEAR<br />
Total suspended solids (TSS) has<br />
shown a great deal of variability<br />
over the long term study period.<br />
Nonetheless, a decreasing trend<br />
has been detected in TSS in the<br />
cove with the trend line<br />
decreasing from about 30 mg/L in<br />
1983 to about 20 mg/L in 2003<br />
(Figure 92). Linear regression<br />
was significant indicating a<br />
decline of -0.58 mg/L per year<br />
yielding a total decline of 11.6<br />
mg/L since 1984 (Table 11).<br />
Figure 92. Long term trend in Total Suspended Solids (NC Lab Data). Station 7. Gunston<br />
Cove.<br />
Total Suspended Solids (mg/L)<br />
100<br />
10<br />
Station 9: June-Sept<br />
1<br />
1980 1985 1990 1995 2000 2005<br />
YEAR<br />
In the river TSS trends have<br />
not been as apparent (Figure<br />
93). There has been a slight<br />
increase in the LOWESS<br />
curve for TSS in the river<br />
over the long term study<br />
period. In the river TSS did<br />
not exhibit a significant linear<br />
trend (Table 11).<br />
Figure 93. Long term trend in Total Suspended Solids (NC Lab Data). Station 9. Potomac<br />
mainstem.<br />
77


