

NEW: Annual Report - George Mason University
NEW: Annual Report - George Mason University
NEW: Annual Report - George Mason University

You also want an ePaper? Increase the reach of your titles
YUMPU automatically turns print PDFs into web optimized ePapers that Google loves.
64<br />
Water Temperature (oC)<br />
35<br />
30<br />
25<br />
20<br />
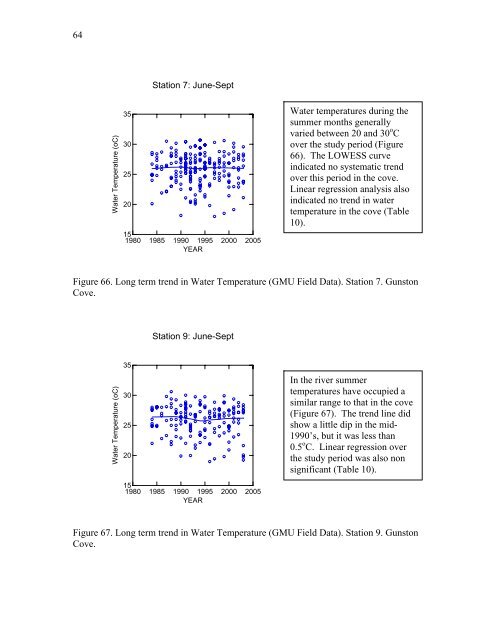
Station 7: June-Sept<br />
15<br />
1980 1985 1990 1995 2000 2005<br />
YEAR<br />
Water temperatures during the<br />
summer months generally<br />
varied between 20 and 30 o C<br />
over the study period (Figure<br />
66). The LOWESS curve<br />
indicated no systematic trend<br />
over this period in the cove.<br />
Linear regression analysis also<br />
indicated no trend in water<br />
temperature in the cove (Table<br />
10).<br />
Figure 66. Long term trend in Water Temperature (GMU Field Data). Station 7. Gunston<br />
Cove.<br />
Water Temperature (oC)<br />
35<br />
30<br />
25<br />
20<br />
Station 9: June-Sept<br />
15<br />
1980 1985 1990 1995 2000 2005<br />
YEAR<br />
In the river summer<br />
temperatures have occupied a<br />
similar range to that in the cove<br />
(Figure 67). The trend line did<br />
show a little dip in the mid-<br />
1990’s, but it was less than<br />
0.5 o C. Linear regression over<br />
the study period was also non<br />
significant (Table 10).<br />
Figure 67. Long term trend in Water Temperature (GMU Field Data). Station 9. Gunston<br />
Cove.


