NEW: Annual Report - George Mason University
NEW: Annual Report - George Mason University
NEW: Annual Report - George Mason University
You also want an ePaper? Increase the reach of your titles
YUMPU automatically turns print PDFs into web optimized ePapers that Google loves.
20<br />
Ammonia Nitrogen (mg/L)<br />
0.30<br />
0.25<br />
0.20<br />
0.15<br />
0.10<br />
0.05<br />
0.00<br />
Station 7<br />
Station 9<br />
Gunston Cove Study - 2003<br />
Mar Apr May Jun Jul Aug Sep Oct Nov Dec Jan<br />
Ammonia nitrogen measures the<br />
+<br />
amount of ammonium ion (NH4 )<br />
and ammonia gas (NH3)<br />
dissolved in the water. Ammonia<br />
nitrogen is readily available to<br />
algae and aquatic plants and<br />
acts to stimulate their growth.<br />
While phosphorus is normally<br />
the most limiting nutrient in<br />
freshwater, nitrogen is a close<br />
second. Ammonia nitrogen is<br />
rapidly oxidized to nitrate<br />
nitrogen when oxygen is present<br />
in the water. So, elevated levels<br />
of ammonia nitrogen (>0.5 mg/L)<br />
are generally associated with<br />
nearby discharge of wastewater.<br />
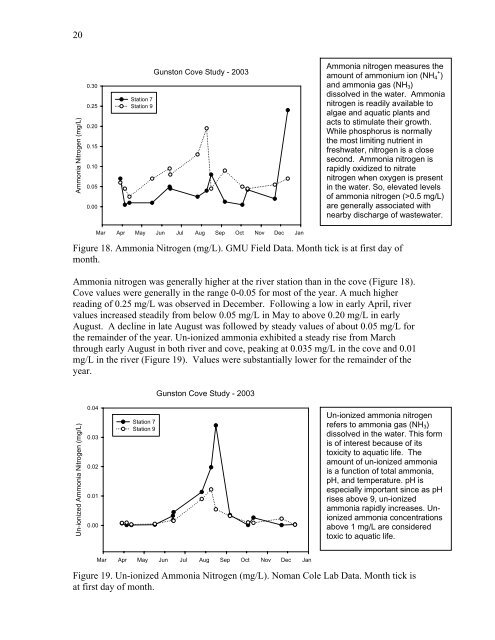
Figure 18. Ammonia Nitrogen (mg/L). GMU Field Data. Month tick is at first day of<br />
month.<br />
Ammonia nitrogen was generally higher at the river station than in the cove (Figure 18).<br />
Cove values were generally in the range 0-0.05 for most of the year. A much higher<br />
reading of 0.25 mg/L was observed in December. Following a low in early April, river<br />
values increased steadily from below 0.05 mg/L in May to above 0.20 mg/L in early<br />
August. A decline in late August was followed by steady values of about 0.05 mg/L for<br />
the remainder of the year. Un-ionized ammonia exhibited a steady rise from March<br />
through early August in both river and cove, peaking at 0.035 mg/L in the cove and 0.01<br />
mg/L in the river (Figure 19). Values were substantially lower for the remainder of the<br />
year.<br />
Un-ionized Ammonia Nitrogen (mg/L)<br />
0.04<br />
0.03<br />
0.02<br />
0.01<br />
0.00<br />
Station 7<br />
Station 9<br />
Gunston Cove Study - 2003<br />
Mar Apr May Jun Jul Aug Sep Oct Nov Dec Jan<br />
Un-ionized ammonia nitrogen<br />
refers to ammonia gas (NH3)<br />
dissolved in the water. This form<br />
is of interest because of its<br />
toxicity to aquatic life. The<br />
amount of un-ionized ammonia<br />
is a function of total ammonia,<br />
pH, and temperature. pH is<br />
especially important since as pH<br />
rises above 9, un-ionized<br />
ammonia rapidly increases. Unionized<br />
ammonia concentrations<br />
above 1 mg/L are considered<br />
toxic to aquatic life.<br />
Figure 19. Un-ionized Ammonia Nitrogen (mg/L). Noman Cole Lab Data. Month tick is<br />
at first day of month.


