

NEW: Annual Report - George Mason University
NEW: Annual Report - George Mason University
NEW: Annual Report - George Mason University

Create successful ePaper yourself
Turn your PDF publications into a flip-book with our unique Google optimized e-Paper software.
Total Alkalinity (mg/L CaCO3), Noman Cole Lab<br />
110<br />
100<br />
90<br />
80<br />
70<br />
60<br />
50<br />
40<br />
30<br />
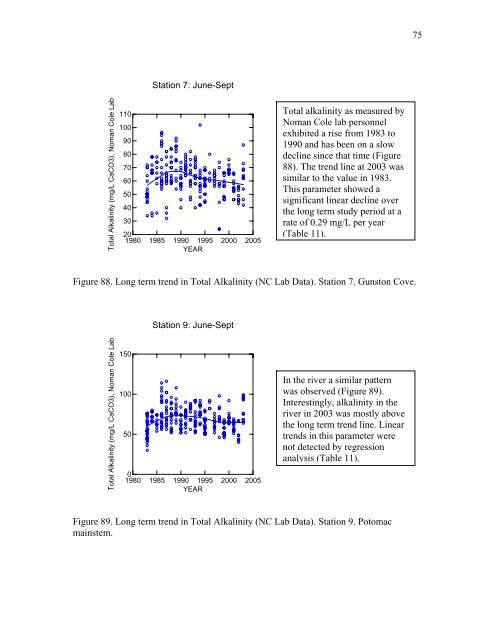
Station 7: June-Sept<br />
20<br />
1980 1985 1990 1995 2000 2005<br />
YEAR<br />
Total alkalinity as measured by<br />
Noman Cole lab personnel<br />
exhibited a rise from 1983 to<br />
1990 and has been on a slow<br />
decline since that time (Figure<br />
88). The trend line at 2003 was<br />
similar to the value in 1983.<br />
This parameter showed a<br />
significant linear decline over<br />
the long term study period at a<br />
rate of 0.29 mg/L per year<br />
(Table 11).<br />
Figure 88. Long term trend in Total Alkalinity (NC Lab Data). Station 7. Gunston Cove.<br />
Total Alkalinity (mg/L CaCO3), Noman Cole Lab<br />
150<br />
100<br />
50<br />
Station 9: June-Sept<br />
0<br />
1980 1985 1990 1995 2000 2005<br />
YEAR<br />
In the river a similar pattern<br />
was observed (Figure 89).<br />
Interestingly, alkalinity in the<br />
river in 2003 was mostly above<br />
the long term trend line. Linear<br />
trends in this parameter were<br />
not detected by regression<br />
analysis (Table 11).<br />
Figure 89. Long term trend in Total Alkalinity (NC Lab Data). Station 9. Potomac<br />
mainstem.<br />
75


