

NEW: Annual Report - George Mason University
NEW: Annual Report - George Mason University
NEW: Annual Report - George Mason University

You also want an ePaper? Increase the reach of your titles
YUMPU automatically turns print PDFs into web optimized ePapers that Google loves.
66<br />
Chloride (mg/L)<br />
350<br />
300<br />
250<br />
200<br />
150<br />
100<br />
50<br />
Station 7: June-Sept<br />
1980 1985 1990 1995 2000 2005<br />
YEAR<br />
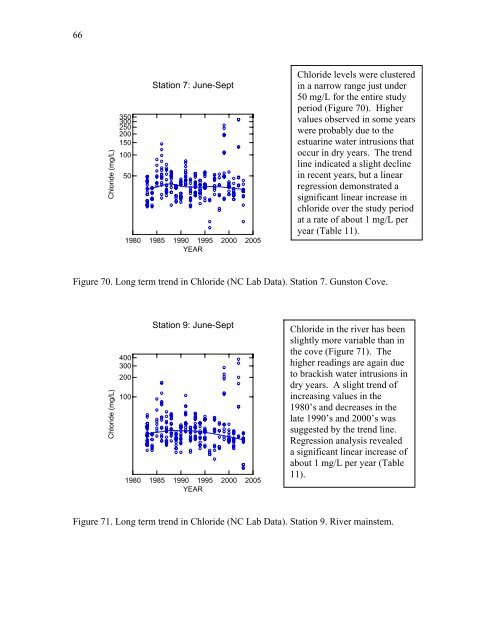
Chloride levels were clustered<br />
in a narrow range just under<br />
50 mg/L for the entire study<br />
period (Figure 70). Higher<br />
values observed in some years<br />
were probably due to the<br />
estuarine water intrusions that<br />
occur in dry years. The trend<br />
line indicated a slight decline<br />
in recent years, but a linear<br />
regression demonstrated a<br />
significant linear increase in<br />
chloride over the study period<br />
at a rate of about 1 mg/L per<br />
year (Table 11).<br />
Figure 70. Long term trend in Chloride (NC Lab Data). Station 7. Gunston Cove.<br />
Chloride (mg/L)<br />
400<br />
300<br />
200<br />
100<br />
Station 9: June-Sept<br />
1980 1985 1990 1995 2000 2005<br />
YEAR<br />
Chloride in the river has been<br />
slightly more variable than in<br />
the cove (Figure 71). The<br />
higher readings are again due<br />
to brackish water intrusions in<br />
dry years. A slight trend of<br />
increasing values in the<br />
1980’s and decreases in the<br />
late 1990’s and 2000’s was<br />
suggested by the trend line.<br />
Regression analysis revealed<br />
a significant linear increase of<br />
about 1 mg/L per year (Table<br />
11).<br />
Figure 71. Long term trend in Chloride (NC Lab Data). Station 9. River mainstem.


