

NEW: Annual Report - George Mason University
NEW: Annual Report - George Mason University
NEW: Annual Report - George Mason University

You also want an ePaper? Increase the reach of your titles
YUMPU automatically turns print PDFs into web optimized ePapers that Google loves.
104<br />
Copepod Nauplii (#/L)<br />
1000.0<br />
100.0<br />
10.0<br />
1.0<br />
Station 7: All Months<br />
1985 1990 1995 2000 2005<br />
YEAR<br />
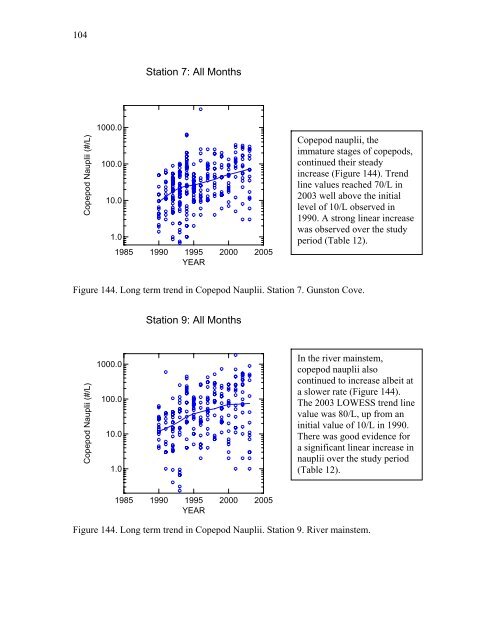
Copepod nauplii, the<br />
immature stages of copepods,<br />
continued their steady<br />
increase (Figure 144). Trend<br />
line values reached 70/L in<br />
2003 well above the initial<br />
level of 10/L observed in<br />
1990. A strong linear increase<br />
was observed over the study<br />
period (Table 12).<br />
Figure 144. Long term trend in Copepod Nauplii. Station 7. Gunston Cove.<br />
Copepod Nauplii (#/L)<br />
1000.0<br />
100.0<br />
10.0<br />
1.0<br />
Station 9: All Months<br />
1985 1990 1995 2000 2005<br />
YEAR<br />
In the river mainstem,<br />
copepod nauplii also<br />
continued to increase albeit at<br />
a slower rate (Figure 144).<br />
The 2003 LOWESS trend line<br />
value was 80/L, up from an<br />
initial value of 10/L in 1990.<br />
There was good evidence for<br />
a significant linear increase in<br />
nauplii over the study period<br />
(Table 12).<br />
Figure 144. Long term trend in Copepod Nauplii. Station 9. River mainstem.


