

NEW: Annual Report - George Mason University
NEW: Annual Report - George Mason University
NEW: Annual Report - George Mason University

Create successful ePaper yourself
Turn your PDF publications into a flip-book with our unique Google optimized e-Paper software.
Mean Catch Per Seine<br />
60<br />
50<br />
40<br />
30<br />
20<br />
10<br />
Seine Stations 4, 6, and 11<br />
Spottail Shiner and Inland Silverside<br />
Spottail Shiner<br />
Inland Silverside<br />
0<br />
1984 1986 1988 1990 1992 1994 1996 1998 2000 2002 2004<br />
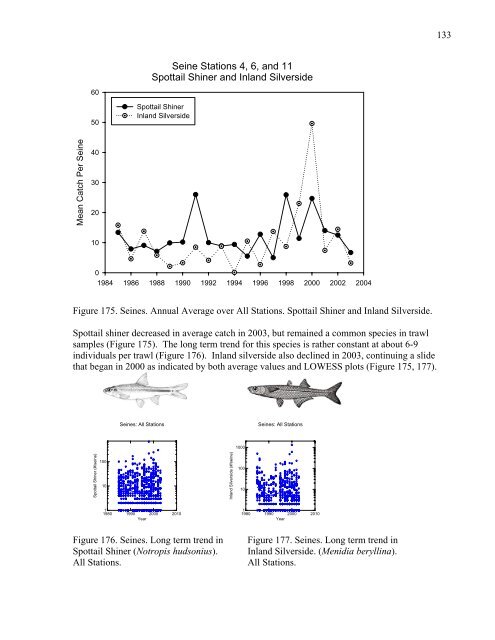
Figure 175. Seines. <strong>Annual</strong> Average over All Stations. Spottail Shiner and Inland Silverside.<br />
Spottail shiner decreased in average catch in 2003, but remained a common species in trawl<br />
samples (Figure 175). The long term trend for this species is rather constant at about 6-9<br />
individuals per trawl (Figure 176). Inland silverside also declined in 2003, continuing a slide<br />
that began in 2000 as indicated by both average values and LOWESS plots (Figure 175, 177).<br />
Spottail Shiner (#/seine)<br />
100<br />
10<br />
Seines: All Stations<br />
1<br />
1980 1990 2000 2010<br />
Year<br />
Inland Silverside (#/seine)<br />
1000<br />
100<br />
10<br />
Seines: All Stations<br />
1<br />
1980 1990 2000 2010<br />
Year<br />
Figure 176. Seines. Long term trend in Figure 177. Seines. Long term trend in<br />
Spottail Shiner (Notropis hudsonius). Inland Silverside. (Menidia beryllina).<br />
All Stations. All Stations.<br />
133


