

NEW: Annual Report - George Mason University
NEW: Annual Report - George Mason University
NEW: Annual Report - George Mason University

You also want an ePaper? Increase the reach of your titles
YUMPU automatically turns print PDFs into web optimized ePapers that Google loves.
Adult and Copepodid Copepods (#/m3)<br />
10000<br />
1000<br />
100<br />
10<br />
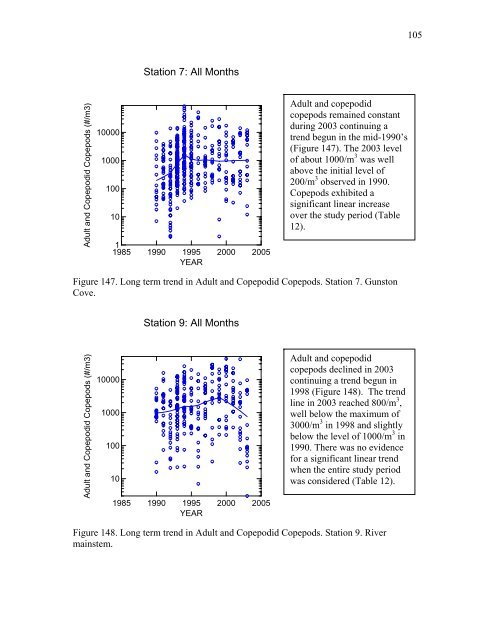
Station 7: All Months<br />
1<br />
1985 1990 1995<br />
YEAR<br />
2000 2005<br />
Adult and copepodid<br />
copepods remained constant<br />
during 2003 continuing a<br />
trend begun in the mid-1990’s<br />
(Figure 147). The 2003 level<br />
of about 1000/m 3 was well<br />
above the initial level of<br />
200/m 3 observed in 1990.<br />
Copepods exhibited a<br />
significant linear increase<br />
over the study period (Table<br />
12).<br />
Figure 147. Long term trend in Adult and Copepodid Copepods. Station 7. Gunston<br />
Cove.<br />
Adult and Copepodid Copepods (#/m3)<br />
10000<br />
1000<br />
100<br />
10<br />
Station 9: All Months<br />
1985 1990 1995 2000 2005<br />
YEAR<br />
Adult and copepodid<br />
copepods declined in 2003<br />
continuing a trend begun in<br />
1998 (Figure 148). The trend<br />
line in 2003 reached 800/m 3 ,<br />
well below the maximum of<br />
3000/m 3 in 1998 and slightly<br />
below the level of 1000/m 3 in<br />
1990. There was no evidence<br />
for a significant linear trend<br />
when the entire study period<br />
was considered (Table 12).<br />
Figure 148. Long term trend in Adult and Copepodid Copepods. Station 9. River<br />
mainstem.<br />
105


