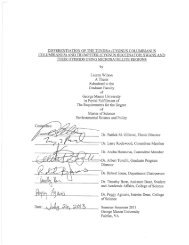
Sample A: Cover Page of Thesis, Project, or Dissertation Proposal
Sample A: Cover Page of Thesis, Project, or Dissertation Proposal
Sample A: Cover Page of Thesis, Project, or Dissertation Proposal
Create successful ePaper yourself
Turn your PDF publications into a flip-book with our unique Google optimized e-Paper software.
outliers. Because they had already been c<strong>or</strong>rected to maintain variance across m<strong>or</strong>e<br />
n<strong>or</strong>mal data distributions, these outliers were left in the dataset.<br />
Subsequent data distributions <strong>of</strong> all subscale and variable aggregate sc<strong>or</strong>es were<br />
skewed and kurtotic, but not to an extent to warrant data transf<strong>or</strong>mations. Bivariate<br />
scatterplots <strong>of</strong> each independent-dependent variable pair f<strong>or</strong> all analyses did not reveal<br />
any significant outliers f<strong>or</strong> any analysis perf<strong>or</strong>med.<br />
Preliminary Data Analyses<br />
Table 4 summarizes the experimental design <strong>of</strong> the study. Classrooms were<br />
divided into two experimental groups f<strong>or</strong> intervention implementation: the intervention<br />
group, in which teachers implemented dialogic reading techniques while reading<br />
emotion-laden st<strong>or</strong>ybooks in small groups; and the book reading control group, in which<br />
teachers read the same st<strong>or</strong>ybooks provided to the intervention group without using<br />
dialogic reading techniques (i.e., teachers read st<strong>or</strong>ybooks as they would typically read).<br />
Descriptive Data<br />
Teachers completed a total <strong>of</strong> 84.4% <strong>of</strong> all possible assigned readings. Tables 19<br />
and 20 include descriptive data f<strong>or</strong> st<strong>or</strong>ybook readings completed f<strong>or</strong> classrooms and<br />
teachers in total and f<strong>or</strong> experimental groups. Overall, classrooms completed a mean <strong>of</strong><br />
60.77 (SD = 15.30, range = 26-73) <strong>of</strong> 72 possible readings (36 readings per each <strong>of</strong> 2<br />
groups <strong>of</strong> children in each classroom); and teachers completed a mean <strong>of</strong> 29.52 (SD =<br />
22.20, range = 2-73) <strong>of</strong> 72 possible readings. Table 21 includes percentages <strong>of</strong> st<strong>or</strong>ybook<br />
reading completed by lead teachers, assistant teachers, and teaching assistants in full- and<br />
half-day classrooms. Overall, lead teachers completed approximately 73.9% <strong>of</strong> all<br />
90


![[Sample B: Approval/Signature Sheet] - George Mason University](https://img.yumpu.com/21978828/1/190x245/sample-b-approval-signature-sheet-george-mason-university.jpg?quality=85)
![[Sample B: Approval/Signature Sheet] - George Mason University](https://img.yumpu.com/18694905/1/190x245/sample-b-approval-signature-sheet-george-mason-university.jpg?quality=85)


![[Sample B: Approval/Signature Sheet] - George Mason University](https://img.yumpu.com/18694552/1/189x260/sample-b-approval-signature-sheet-george-mason-university.jpg?quality=85)
![[Sample B: Approval/Signature Sheet] - George Mason University](https://img.yumpu.com/18694474/1/190x245/sample-b-approval-signature-sheet-george-mason-university.jpg?quality=85)