Intel HD Graphics DirectX Developer's Guide (Sandy Bridge)
Intel HD Graphics DirectX Developer's Guide (Sandy Bridge)
Intel HD Graphics DirectX Developer's Guide (Sandy Bridge)

You also want an ePaper? Increase the reach of your titles
YUMPU automatically turns print PDFs into web optimized ePapers that Google loves.
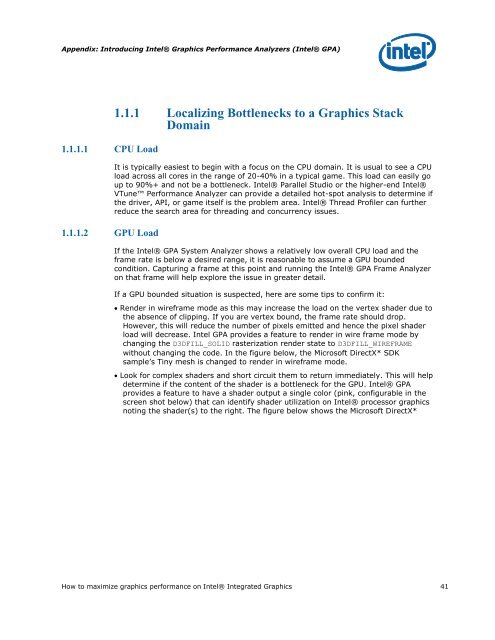
Appendix: Introducing <strong>Intel</strong>® <strong>Graphics</strong> Performance Analyzers (<strong>Intel</strong>® GPA)<br />
1.1.1.1 CPU Load<br />
1.1.1.2 GPU Load<br />
1.1.1 Localizing Bottlenecks to a <strong>Graphics</strong> Stack<br />
Domain<br />
It is typically easiest to begin with a focus on the CPU domain. It is usual to see a CPU<br />
load across all cores in the range of 20-40% in a typical game. This load can easily go<br />
up to 90%+ and not be a bottleneck. <strong>Intel</strong>® Parallel Studio or the higher-end <strong>Intel</strong>®<br />
VTune Performance Analyzer can provide a detailed hot-spot analysis to determine if<br />
the driver, API, or game itself is the problem area. <strong>Intel</strong>® Thread Profiler can further<br />
reduce the search area for threading and concurrency issues.<br />
If the <strong>Intel</strong>® GPA System Analyzer shows a relatively low overall CPU load and the<br />
frame rate is below a desired range, it is reasonable to assume a GPU bounded<br />
condition. Capturing a frame at this point and running the <strong>Intel</strong>® GPA Frame Analyzer<br />
on that frame will help explore the issue in greater detail.<br />
If a GPU bounded situation is suspected, here are some tips to confirm it:<br />
Render in wireframe mode as this may increase the load on the vertex shader due to<br />
the absence of clipping. If you are vertex bound, the frame rate should drop.<br />
However, this will reduce the number of pixels emitted and hence the pixel shader<br />
load will decrease. <strong>Intel</strong> GPA provides a feature to render in wire frame mode by<br />
changing the D3DFILL_SOLID rasterization render state to D3DFILL_WIREFRAME<br />
without changing the code. In the figure below, the Microsoft <strong>DirectX</strong>* SDK<br />
sample‟s Tiny mesh is changed to render in wireframe mode.<br />
Look for complex shaders and short circuit them to return immediately. This will help<br />
determine if the content of the shader is a bottleneck for the GPU. <strong>Intel</strong>® GPA<br />
provides a feature to have a shader output a single color (pink, configurable in the<br />
screen shot below) that can identify shader utilization on <strong>Intel</strong>® processor graphics<br />
noting the shader(s) to the right. The figure below shows the Microsoft <strong>DirectX</strong>*<br />
How to maximize graphics performance on <strong>Intel</strong>® Integrated <strong>Graphics</strong> 41