Intel HD Graphics DirectX Developer's Guide (Sandy Bridge)
Intel HD Graphics DirectX Developer's Guide (Sandy Bridge)
Intel HD Graphics DirectX Developer's Guide (Sandy Bridge)

You also want an ePaper? Increase the reach of your titles
YUMPU automatically turns print PDFs into web optimized ePapers that Google loves.
<strong>Intel</strong>® <strong>HD</strong> <strong>Graphics</strong> <strong>DirectX</strong>* <strong>Developer's</strong> <strong>Guide</strong><br />
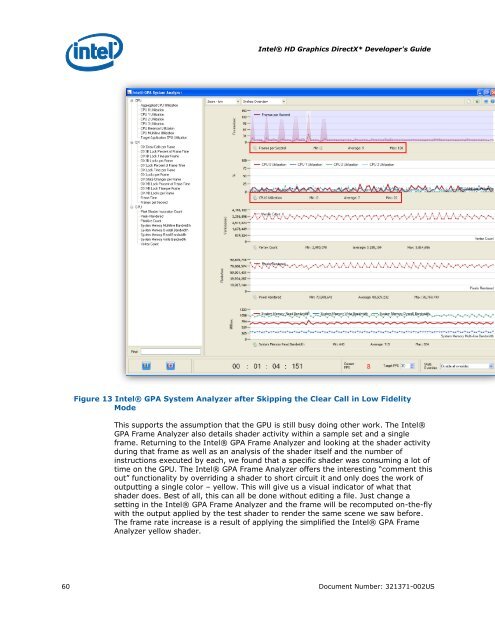
Figure 13 <strong>Intel</strong>® GPA System Analyzer after Skipping the Clear Call in Low Fidelity<br />
Mode<br />
This supports the assumption that the GPU is still busy doing other work. The <strong>Intel</strong>®<br />
GPA Frame Analyzer also details shader activity within a sample set and a single<br />
frame. Returning to the <strong>Intel</strong>® GPA Frame Analyzer and looking at the shader activity<br />
during that frame as well as an analysis of the shader itself and the number of<br />
instructions executed by each, we found that a specific shader was consuming a lot of<br />
time on the GPU. The <strong>Intel</strong>® GPA Frame Analyzer offers the interesting “comment this<br />
out” functionality by overriding a shader to short circuit it and only does the work of<br />
outputting a single color – yellow. This will give us a visual indicator of what that<br />
shader does. Best of all, this can all be done without editing a file. Just change a<br />
setting in the <strong>Intel</strong>® GPA Frame Analyzer and the frame will be recomputed on-the-fly<br />
with the output applied by the test shader to render the same scene we saw before.<br />
The frame rate increase is a result of applying the simplified the <strong>Intel</strong>® GPA Frame<br />
Analyzer yellow shader.<br />
60 Document Number: 321371-002US