Intel HD Graphics DirectX Developer's Guide (Sandy Bridge)
Intel HD Graphics DirectX Developer's Guide (Sandy Bridge)
Intel HD Graphics DirectX Developer's Guide (Sandy Bridge)

Create successful ePaper yourself
Turn your PDF publications into a flip-book with our unique Google optimized e-Paper software.
Appendix: Enhancing <strong>Graphics</strong> Performance on <strong>Intel</strong>® Processor <strong>Graphics</strong> with <strong>Intel</strong>® GPA<br />
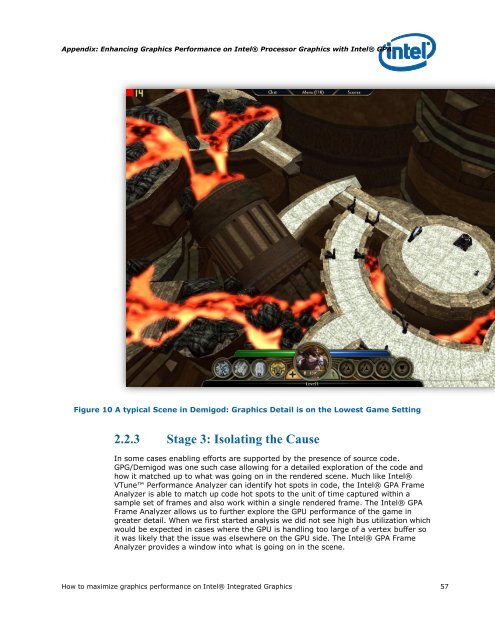
Figure 10 A typical Scene in Demigod: <strong>Graphics</strong> Detail is on the Lowest Game Setting<br />
2.2.3 Stage 3: Isolating the Cause<br />
In some cases enabling efforts are supported by the presence of source code.<br />
GPG/Demigod was one such case allowing for a detailed exploration of the code and<br />
how it matched up to what was going on in the rendered scene. Much like <strong>Intel</strong>®<br />
VTune Performance Analyzer can identify hot spots in code, the <strong>Intel</strong>® GPA Frame<br />
Analyzer is able to match up code hot spots to the unit of time captured within a<br />
sample set of frames and also work within a single rendered frame. The <strong>Intel</strong>® GPA<br />
Frame Analyzer allows us to further explore the GPU performance of the game in<br />
greater detail. When we first started analysis we did not see high bus utilization which<br />
would be expected in cases where the GPU is handling too large of a vertex buffer so<br />
it was likely that the issue was elsewhere on the GPU side. The <strong>Intel</strong>® GPA Frame<br />
Analyzer provides a window into what is going on in the scene.<br />
How to maximize graphics performance on <strong>Intel</strong>® Integrated <strong>Graphics</strong> 57