Gasoline Price Changes - Federal Trade Commission
Gasoline Price Changes - Federal Trade Commission
Gasoline Price Changes - Federal Trade Commission

You also want an ePaper? Increase the reach of your titles
YUMPU automatically turns print PDFs into web optimized ePapers that Google loves.
GASOLINE PRICE CHANGES:<br />
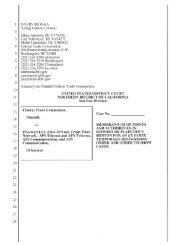
Figure 4-4: Map of U.S. PADDs<br />
Of course, these regions are geographically quite large. Different locations within a PADD, as<br />
discussed above, may have different degrees of access to sources of gasoline supply. Also, while<br />
these regions are useful for data collection, they may not represent a relevant geographic market<br />
for antitrust purposes.<br />
In 2003, the U.S. consumed about 3.3 trillion barrels of gasoline, up from roughly 2.5<br />
trillion barrels in 1985. Regions of the U.S. differ significantly in how much of this gasoline<br />
they consume. The EIA estimates total annual consumption of gasoline in each PADD by<br />
adding the region’s refinery production of gasoline, “other” production, such as ethanol, MTBE,<br />
and alkylates (typically a small amount), 33 imports of gasoline from outside the U.S., and<br />
deliveries of gasoline from other PADDs. The EIA then subtracts the region’s exports of<br />
gasoline to locations outside the U.S. and deliveries to other PADDs. This results in a number<br />
that represents “product supplied” to each region and therefore approximates gasoline<br />
consumption in that region. 34<br />
78<br />
FEDERAL TRADE COMMISSION, JUNE 2005