Gasoline Price Changes - Federal Trade Commission
Gasoline Price Changes - Federal Trade Commission
Gasoline Price Changes - Federal Trade Commission

Create successful ePaper yourself
Turn your PDF publications into a flip-book with our unique Google optimized e-Paper software.
GASOLINE PRICE CHANGES:<br />
Millions Barrels Per Day<br />
100<br />
90<br />
80<br />
70<br />
60<br />
50<br />
40<br />
30<br />
20<br />
10<br />
0<br />
Source: IEA<br />
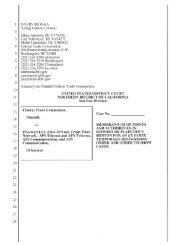
Figure 2-5: World Oil Consumption by Region,<br />
1999 and 2004, Millions Barrels per Day<br />
1999 World Total:<br />
75.3<br />
Rest Of World: 7.0<br />
Middle East: 4.3<br />
Other Asia<br />
(inc. India): 14.9<br />
China: 4.5<br />
Latin America: 4.9<br />
Europe: 15.9<br />
Canada & Mexico 4.3<br />
United States: 19.5<br />
1 Numbers may not add up due to rounding.<br />
Growth: 1<br />
7.1<br />
+0.5<br />
+1.6<br />
+1.4<br />
+1.8<br />
--<br />
+0.6<br />
+0.4<br />
+ 0.9<br />
2004 World Total:<br />
82.4<br />
Rest Of World: 7.5<br />
Middle East: 5.9<br />
Other Asia<br />
(inc. India): 16.2<br />
China: 6.3<br />
Latin America: 4.9<br />
Europe: 16.5<br />
Canada & Mexico 4.6<br />
United States: 20.4<br />
Thus, that demand for crude oil increased in 2004 was not a surprise. What was a<br />
surprise, however, was the rate at which world demand grew. The actual rate at which demand<br />
for crude oil grew in 2004 far outstripped the projections of likely growth in world demand from<br />
the International Energy Agency (IEA) and OPEC. 44 Projections had placed likely growth in<br />
world demand for crude oil at 1.5 percent. In fact, the 2004 rate of growth in crude demand was<br />
3.3 percent – more than double the projections. See Figure 2-6.<br />
26<br />
FEDERAL TRADE COMMISSION, JUNE 2005