Gasoline Price Changes - Federal Trade Commission
Gasoline Price Changes - Federal Trade Commission
Gasoline Price Changes - Federal Trade Commission

Create successful ePaper yourself
Turn your PDF publications into a flip-book with our unique Google optimized e-Paper software.
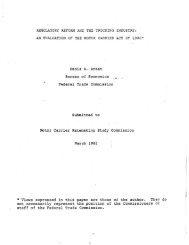
<strong>Price</strong> (Cents per Gallon Excluding Taxes)<br />
250<br />
200<br />
150<br />
100<br />
50<br />
0<br />
1978<br />
1979<br />
Source: EIA, BEA<br />
THE DYNAMIC OF SUPPLY, DEMAND, AND COMPETITION<br />
Figure 3-2: U.S. Annual Average Nominal and Real <strong>Gasoline</strong> <strong>Price</strong>s, Excluding Taxes<br />
(1978-2004)<br />
Nominal <strong>Price</strong><br />
Real <strong>Price</strong><br />
(2004 Dollars)<br />
1980<br />
1981<br />
1982<br />
1983<br />
1984<br />
1985<br />
1986<br />
1987<br />
1988<br />
1989<br />
1990<br />
1991<br />
1992<br />
1993<br />
1994<br />
1995<br />
1996<br />
1997<br />
1998<br />
1999<br />
2000<br />
2001<br />
2002<br />
2003<br />
2004<br />
Average U.S. retail prices, including taxes, 6 have been increasing since 2003, from an<br />
average of $1.56 in 2003 to an average of $2.04 in the first five months of 2005, but it is difficult<br />
to predict whether these increases represent the beginning of a longer term trend.<br />
$ To Meet Increased U.S. Demand for <strong>Gasoline</strong>, U.S. Refiners Have Taken Advantage of<br />
Economies of Scale and Adopted More Efficient Technologies and Business Strategies.<br />
U.S. refinery production meets more than 90 percent of U.S. demand for gasoline, on<br />
average. Between 1985 and 2004, U.S. refineries increased their total capacity to refine crude oil<br />
into various refined petroleum products by 7.8 percent, moving from 15.7 million barrels per day<br />
in 1985 to 16.9 million barrels per day as of May 2004. This increase – approximately one<br />
million barrels per day – is roughly equivalent to adding 10 average-sized refineries to industry<br />
supply. This increase occurred even though U.S. refiners did not build any new refineries during<br />
this time and, as refineries were closed, the number of overall refineries declined. Rather, they<br />
added this capacity through the expansion of existing refineries, enabling them to take advantage<br />
of economies of scale. All else equal, scale economies make larger refineries more efficient than<br />
small refineries. U.S. refiners also have adopted processing methods that broaden the range of<br />
crude oil that they can process and allow them to produce more refined product for each barrel of<br />
crude they process. In addition, they have lowered inventory holdings, thereby lowering<br />
inventory costs. Lower inventory holdings may, however, make an area more susceptible to<br />
short-term price spikes when there is a disruption in supply.<br />
EXECUTIVE SUMMARY ix