Study Guide and Intervention (continued) - MathnMind
Study Guide and Intervention (continued) - MathnMind
Study Guide and Intervention (continued) - MathnMind

You also want an ePaper? Increase the reach of your titles
YUMPU automatically turns print PDFs into web optimized ePapers that Google loves.
1-9<br />
NAME ______________________________________________ DATE ____________ PERIOD _____<br />
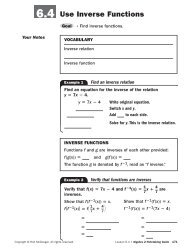
<strong>Study</strong> <strong>Guide</strong> <strong>and</strong> <strong>Intervention</strong><br />
Statistics: Analyzing Data by Using Tables <strong>and</strong> Graphs<br />
Analyze Data Graphs or tables can be used to display data. A bar graph compares<br />
different categories of data, while a circle graph compares parts of a set of data as a<br />
percent of the whole set. A line graph is useful to show how a data set changes over time.<br />
Example<br />
The circle graph at the right shows the<br />
number of international visitors to the United States<br />
in 2000, by country.<br />
a. If there were a total of 50,891,000 visitors, how<br />
many were from Mexico?<br />
50,891,000 20% 10,178,200<br />
b. If the percentage of visitors from each country<br />
remains the same each year, how many visitors<br />
from Canada would you expect in the year 2003<br />
if the total is 59,000,000 visitors?<br />
59,000,000 29% 17,110,000<br />
Exercises<br />
1. The graph shows the use of imported steel by U. S.<br />
companies over a 10-year period.<br />
a. Describe the general trend in the graph.<br />
b. What would be a reasonable prediction for the<br />
percentage of imported steel used in 2002?<br />
2. The table shows the percentage of change in worker<br />
productivity at the beginning of each year for a<br />
5-year period.<br />
a. Which year shows the greatest percentage increase<br />
in productivity?<br />
b. What does the negative percent in the first quarter<br />
of 2001 indicate?<br />
Imported Steel as<br />
Percent of Total Used<br />
40<br />
30<br />
20<br />
10<br />
0<br />
1990 1994 1998<br />
Year<br />
Worker Productivity Index<br />
Year (1st Qtr.) % of Change<br />
1997 1<br />
1998 4.6<br />
1999 2<br />
2000 2.1<br />
2001 1.2<br />
Source: Chicago Tribune<br />
© Glencoe/McGraw-Hill 49 Glencoe Algebra 1<br />
Percent<br />
International Visitors<br />
to the U.S., 2000<br />
United<br />
Kingdom<br />
9%<br />
Source: TInet<br />
Others<br />
32%<br />
Japan<br />
10%<br />
Source: Chicago Tribune<br />
Canada<br />
29%<br />
Mexico<br />
20%<br />
Lesson 1-9