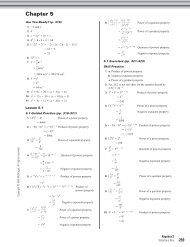
Study Guide and Intervention (continued) - MathnMind
Study Guide and Intervention (continued) - MathnMind
Study Guide and Intervention (continued) - MathnMind

You also want an ePaper? Increase the reach of your titles
YUMPU automatically turns print PDFs into web optimized ePapers that Google loves.
5-3<br />
Model Real-World Data<br />
Example<br />
MEDIA Since 1997, the number of cable TV systems has decreased<br />
by an average rate of 121 systems per year. There were 10,943 systems in 1997.<br />
a. Write a linear equation to find the average number of cable systems in any year<br />
after 1997.<br />
The rate of change is 121 systems per year. In the first year, the number of systems was<br />
10,943. Let N the number of cable TV systems. Let x the number of years after 1997.<br />
An equation is N 121x 10,943.<br />
b. Graph the equation.<br />
The graph of N 121x 10,943 is a line that passes<br />
through the point at (0, 10,943) <strong>and</strong> has a slope of 121.<br />
c. Find the approximate number of cable TV<br />
systems in 2000.<br />
N 121x 10,943 Original equation<br />
N 121(3) 10,943 Replace x with 3.<br />
N 10,580 Simplify.<br />
There were about 10,580 cable TV systems in 2000.<br />
Exercises<br />
NAME ______________________________________________ DATE ____________ PERIOD _____<br />
<strong>Study</strong> <strong>Guide</strong> <strong>and</strong> <strong>Intervention</strong> (<strong>continued</strong>)<br />
Slope-Intercept Form<br />
ENTERTAINMENT In 1995, 65.7% of all households<br />
with TV’s in the U.S. subscribed to cable TV. Between 1995<br />
<strong>and</strong> 1999, the percent increased by about 0.6% each year.<br />
1. Write an equation to find the percent P of households that<br />
subscribed to cable TV for any year x between 1995 <strong>and</strong> 1999.<br />
2. Graph the equation on the grid at the right.<br />
3. Find the percent that subscribed to cable TV in 1999.<br />
POPULATION The population of the United States is<br />
projected to be 300 million by the year 2010. Between<br />
2010 <strong>and</strong> 2050, the population is expected to increase by<br />
about 2.5 million per year.<br />
4. Write an equation to find the population P in any year x<br />
between 2010 <strong>and</strong> 2050.<br />
5. Graph the equation on the grid at the right.<br />
6. Find the population in 2050.<br />
Cable TV Systems<br />
Percent of Households<br />
with TV Having Cable<br />
0 1 2 3 4 5 x<br />
Years Since 1995<br />
Source: The World Almanac<br />
Projected United<br />
States Population<br />
P<br />
0 20 40 x<br />
Years Since 2010<br />
Source: The World Almanac<br />
© Glencoe/McGraw-Hill 294 Glencoe Algebra 1<br />
Number of Cable TV Systems<br />
Percent<br />
Population (millions)<br />
N<br />
10,900<br />
10,800<br />
10,700<br />
10,600<br />
10,500<br />
0 1 2 3 4 5 6 x<br />
Years Since 1997<br />
Source: The World Almanac<br />
P<br />
68<br />
67<br />
66<br />
65<br />
400<br />
380<br />
360<br />
340<br />
320<br />
300