

Soins maternels intensifs (Maternal Intensive Care) en Belgique - KCE
Soins maternels intensifs (Maternal Intensive Care) en Belgique - KCE
Soins maternels intensifs (Maternal Intensive Care) en Belgique - KCE

You also want an ePaper? Increase the reach of your titles
YUMPU automatically turns print PDFs into web optimized ePapers that Google loves.
76 <strong>Maternal</strong> <strong>Int<strong>en</strong>sive</strong> <strong>Care</strong> in Belgium <strong>KCE</strong> Reports 94<br />
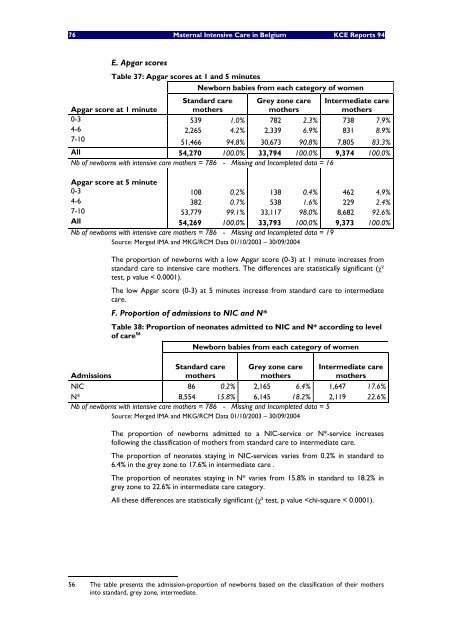
E. Apgar scores<br />
Table 37: Apgar scores at 1 and 5 minutes<br />
Newborn babies from each category of wom<strong>en</strong><br />
Standard care Grey zone care Intermediate care<br />
Apgar score at 1 minute mothers<br />
mothers<br />
mothers<br />
0-3 539 1.0% 782 2.3% 738 7.9%<br />
4-6 2,265 4.2% 2,339 6.9% 831 8.9%<br />
7-10<br />
51,466 94.8% 30,673 90.8% 7,805 83.3%<br />
All 54,270 100.0% 33,794 100.0% 9,374 100.0%<br />
Nb of newborns with int<strong>en</strong>sive care mothers = 786 - Missing and Incompleted data = 16<br />
Apgar score at 5 minute<br />
0-3 108 0.2% 138 0.4% 462 4.9%<br />
4-6 382 0.7% 538 1.6% 229 2.4%<br />
7-10 53,779 99.1% 33,117 98.0% 8,682 92.6%<br />
All 54,269 100.0% 33,793 100.0% 9,373 100.0%<br />
Nb of newborns with int<strong>en</strong>sive care mothers = 786 - Missing and Incompleted data = 19<br />
Source: Merged IMA and MKG/RCM Data 01/10/2003 – 30/09/2004<br />
Admissions<br />
The proportion of newborns with a low Apgar score (0-3) at 1 minute increases from<br />
standard care to int<strong>en</strong>sive care mothers. The differ<strong>en</strong>ces are statistically significant (χ²<br />
test, p value < 0.0001).<br />
The low Apgar score (0-3) at 5 minutes increase from standard care to intermediate<br />
care.<br />
F. Proportion of admissions to NIC and N*<br />
Table 38: Proportion of neonates admitted to NIC and N* according to level<br />
of care 56<br />
Newborn babies from each category of wom<strong>en</strong><br />
Standard care<br />
mothers<br />
Grey zone care<br />
mothers<br />
Intermediate care<br />
mothers<br />
NIC 86 0.2% 2,165 6.4% 1,647 17.6%<br />
N* 8,554 15.8% 6,145 18.2% 2,119 22.6%<br />
Nb of newborns with int<strong>en</strong>sive care mothers = 786 - Missing and Incompleted data = 5<br />
Source: Merged IMA and MKG/RCM Data 01/10/2003 – 30/09/2004<br />
The proportion of newborns admitted to a NIC-service or N*-service increases<br />
following the classification of mothers from standard care to intermediate care.<br />
The proportion of neonates staying in NIC-services varies from 0.2% in standard to<br />
6.4% in the grey zone to 17.6% in intermediate care .<br />
The proportion of neonates staying in N* varies from 15.8% in standard to 18.2% in<br />
grey zone to 22.6% in intermediate care category.<br />
All these differ<strong>en</strong>ces are statistically significant (χ² test, p value


