

Soins maternels intensifs (Maternal Intensive Care) en Belgique - KCE
Soins maternels intensifs (Maternal Intensive Care) en Belgique - KCE
Soins maternels intensifs (Maternal Intensive Care) en Belgique - KCE

You also want an ePaper? Increase the reach of your titles
YUMPU automatically turns print PDFs into web optimized ePapers that Google loves.
<strong>KCE</strong> Reports 94 <strong>Maternal</strong> <strong>Int<strong>en</strong>sive</strong> <strong>Care</strong> in Belgium 79<br />
6 COMPARATIVE ANALYSIS<br />
In this chapter we pres<strong>en</strong>t the results of the comparison betwe<strong>en</strong> the care curr<strong>en</strong>tly<br />
delivered in MIC- and non-MIC services and the care theoretically required in these<br />
services. Following parameters are shown for wom<strong>en</strong> theoretically requiring<br />
intermediate care (~intermediate care wom<strong>en</strong>):<br />
• place of delivery<br />
• type of morbidity,<br />
• rate of referrals and transfers<br />
• proportion of Very Low Birth Weight-infants and premature neonates<br />
A logistic regression model was also used to appreh<strong>en</strong>d the factors associated with an<br />
admission in a maternity with MIC-beds.<br />
6.1 PLACE OF DELIVERY<br />
6.1.1 Proportion of "intermediate care wom<strong>en</strong>” in MIC-services by province<br />
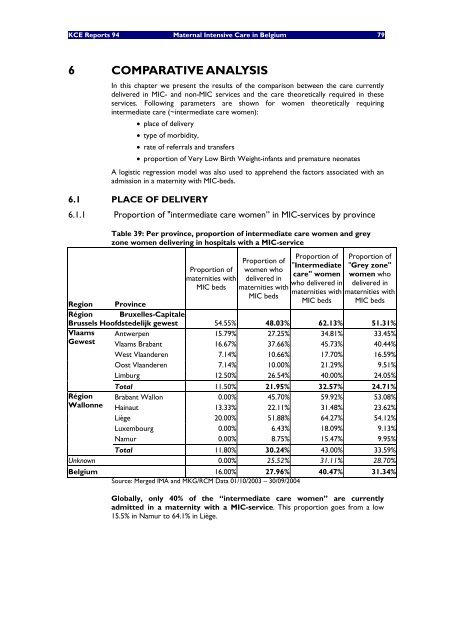
Table 39: Per province, proportion of intermediate care wom<strong>en</strong> and grey<br />
zone wom<strong>en</strong> delivering in hospitals with a MIC-service<br />
Region Province<br />
Proportion of Proportion of<br />
Proportion of<br />
"Intermediate "Grey zone"<br />
Proportion of wom<strong>en</strong> who<br />
care" wom<strong>en</strong> wom<strong>en</strong> who<br />
maternities with delivered in<br />
who delivered in delivered in<br />
MIC beds maternities with<br />
maternities with maternities with<br />
MIC beds<br />
MIC beds MIC beds<br />
Région Bruxelles-Capitale<br />
Brussels Hoofdstedelijk gewest 54.55% 48.03% 62.13% 51.31%<br />
Vlaams Antwerp<strong>en</strong> 15.79% 27.25% 34.81% 33.45%<br />
Gewest Vlaams Brabant 16.67% 37.66% 45.73% 40.44%<br />
West Vlaander<strong>en</strong> 7.14% 10.66% 17.70% 16.59%<br />
Oost Vlaander<strong>en</strong> 7.14% 10.00% 21.29% 9.51%<br />
Limburg 12.50% 26.54% 40.00% 24.05%<br />
Région<br />
Wallonne<br />
Total 11.50% 21.95% 32.57% 24.71%<br />
Brabant Wallon 0.00% 45.70% 59.92% 53.08%<br />
Hainaut 13.33% 22.11% 31.48% 23.62%<br />
Liège 20.00% 51.88% 64.27% 54.12%<br />
Luxembourg 0.00% 6.43% 18.09% 9.13%<br />
Namur 0.00% 8.75% 15.47% 9.95%<br />
Total 11.80% 30.24% 43.00% 33.59%<br />
Unknown 0.00% 25.52% 31.11% 28.70%<br />
Belgium 16.00% 27.96% 40.47% 31.34%<br />
Source: Merged IMA and MKG/RCM Data 01/10/2003 – 30/09/2004<br />
Globally, only 40% of the “intermediate care wom<strong>en</strong>” are curr<strong>en</strong>tly<br />
admitted in a maternity with a MIC-service. This proportion goes from a low<br />
15.5% in Namur to 64.1% in Liège.


