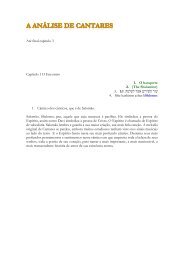
Monitor<strong>in</strong>g Demographic ICPD <strong>in</strong>dicators Goals – Selected Indicators Country, territory or other area Average annual rate Total of population population change, <strong>in</strong> millions, per cent 2013 2010-2015 Life expectancy at birth (years), 2010-2015 Total fertility Population rate, per aged 10-19, woman, per cent, 2010-2015 2010 Sudan 38.0 2.1 60 64 4.5 22 Sur<strong>in</strong>ame 0.5 0.9 68 74 2.3 18 Swaziland 1.2 1.5 50 49 3.4 24 Sweden 9.6 0.7 80 84 1.9 12 Switzerland 8.1 1.0 80 85 1.5 11 Syrian Arab Republic 21.9 0.7 72 78 3.0 21 Tajikistan 8.2 2.4 64 71 3.9 21 Tanzania, United Republic of 49.3 3.0 60 63 5.2 21 Thailand 67.0 0.3 71 78 1.4 14 The former Yugoslav Republic of Macedonia 2.1 0.1 73 77 1.4 14 Timor-Leste, Democratic Republic of 1.1 1.7 66 69 5.9 27 Togo 6.8 2.6 56 57 4.7 21 Tonga 0.1 0.4 70 76 3.8 22 Tr<strong>in</strong>idad and Tobago 1.3 0.3 66 74 1.8 14 Tunisia 11.0 1.1 74 78 2.0 16 Turkey 74.9 1.2 72 79 2.1 17 Turkmenistan 5.2 1.3 61 70 2.3 20 Turks and Caicos Islands 0.0 2.1 Tuvalu 0.0 0.2 Uganda 37.6 3.3 58 60 5.9 22 Ukra<strong>in</strong>e 45.2 -0.6 63 74 1.5 11 United Arab Emirates 9.3 2.5 76 78 1.8 10 United K<strong>in</strong>gdom 63.1 0.6 78 82 1.9 12 United States of America 320.1 0.8 76 81 2.0 13 United States Virg<strong>in</strong> Islands 0.1 0.1 77 83 2.5 14 Uruguay 3.4 0.3 74 80 2.1 15 Uzbekistan 28.9 1.4 65 72 2.3 21 Vanuatu 0.3 2.2 70 74 3.4 20 Venezuela (Bolivarian Republic of) 30.4 1.5 72 78 2.4 18 Viet Nam 91.7 1.0 71 80 1.8 17 Western Sahara 0.6 3.2 66 70 2.4 16 Yemen 24.4 2.3 62 64 4.1 24 Zambia 14.5 3.2 56 59 5.7 22 Zimbabwe 14.1 2.8 59 61 3.5 23 Male Female Average annual rate Life Total Total of population expectancy fertility World and population change, at birth rate, per regional data <strong>in</strong> millions, 2013 per cent 2010-2015 (years), 2010-2015 woman, 2010-2015 Population aged 10-19, per cent, 2010 World 7,162 1.1 68 72 2.5 16.7 More developed regions 8 1,253 0.3 74 81 1.7 11.5 Less developed regions 9 5,909 1.3 67 70 2.6 17.9 Least developed countries 10 898 2.3 59 62 4.2 21.4 Arab States 11 350 1.0 67 71 3.3 20.6 Asia and the Pacific 12 3,785 1.9 69 72 2.2 17.6 Eastern Europe and 330 0.1 63 74 1.8 12.9 Central Asia 13 Lat<strong>in</strong> America and 612 1.1 71 78 2.2 18.7 the Caribbean 14 Sub-Saharan Africa 15 888 2.6 55 57 5.1 23.0 108 INDICATORS 108
Monitor<strong>in</strong>g ICPD Goals – Selected Indicators Notes for <strong>in</strong>dicators 1 Includ<strong>in</strong>g Christmas Island, Cocos (Keel<strong>in</strong>g) Islands and Norfolk Island. 2 For statistical purposes, the data for Ch<strong>in</strong>a do not <strong>in</strong>clude Hong Kong and Macao, Special Adm<strong>in</strong>istrative Regions (SAR) of Ch<strong>in</strong>a, and Taiwan Prov<strong>in</strong>ce of Ch<strong>in</strong>a. 3 As of 1 July 1997, Hong Kong became a Special Adm<strong>in</strong>istrative Region (SAR) of Ch<strong>in</strong>a. 4 As of 20 December 1999, Macao became a Special Adm<strong>in</strong>istrative Region (SAR) of Ch<strong>in</strong>a. 5 Includ<strong>in</strong>g Agalega, Rodrigues and Sa<strong>in</strong>t Brandon. 6 Includ<strong>in</strong>g Kosovo. 7 On 29 November 2012, the United Nations General Assembly passed resolution 67/19. Pursuant to operative paragraph 2 of that resolution, the General Assembly decided to “…accord to Palest<strong>in</strong>e non-member observer State status <strong>in</strong> the United Nations…”. Includes East Jerusalem. 8 More developed regions comprise Europe, Northern America, Australia/New Zealand and Japan. 9 Less developed regions comprise all regions of Africa, Asia (except Japan), Lat<strong>in</strong> America and the Caribbean plus Melanesia, Micronesia and Polynesia. 10 The least developed countries accord<strong>in</strong>g to standard United Nations designation. 11 Includ<strong>in</strong>g Algeria, Bahra<strong>in</strong>, Djibouti, Egypt, Iraq, Jordan, Kuwait, Lebanon, Libya, Morocco, Oman, Palest<strong>in</strong>e, Qatar, Saudi Arabia, Somalia, Sudan, Syrian Arab Republic, Tunisia, United Arab Emirates and Yemen. 12 Includes only UNFPA programme countries, territories or other areas: Afghanistan, Bangladesh, Bhutan, Cambodia, Ch<strong>in</strong>a, Cook Islands, Democratic People's Republic of Korea, Fiji, India, Indonesia, Iran (Islamic Republic of), Kiribati, Lao People's Democratic Republic, Malaysia, Maldives, Marshall Islands, Micronesia, Mongolia, Myanmar, Nauru, Nepal, Niue, Pakistan, Palau, Papua New Gu<strong>in</strong>ea, Philipp<strong>in</strong>es, Samoa, Solomon Islands, Sri Lanka, Thailand, Timor-Leste, Tokelau, Tonga, Tuvalu, Vanuatu, Viet Nam. 13 Includes only UNFPA programme countries, territories or other areas: Albania, Armenia, Azerbaijan, Belarus, Bosnia and Herzegov<strong>in</strong>a, Bulgaria, Georgia, Kazakhstan, Kyrgyzstan, Republic of Moldova, Romania, Russian Federation, Serbia, Tajikistan, The former Yugoslav Republic of Macedonia, Turkmenistan, Ukra<strong>in</strong>e, Uzbekistan. 14 Includes only UNFPA programme countries, territories or other areas: Anguilla, Antigua and Barbuda, Argent<strong>in</strong>a, Bahamas, Barbados, Belize, Bermuda, Bolivia (Plur<strong>in</strong>ational State of), Brazil, British Virg<strong>in</strong> Islands, Cayman Islands, Chile, Colombia, Costa Rica, Cuba, Dom<strong>in</strong>ica, Dom<strong>in</strong>ican Republic, Ecuador, El Salvador, Grenada, Guatemala, Guyana, Haiti, Honduras, Jamaica, Mexico, Montserrat, Netherlands Antilles, Nicaragua, Panama, Paraguay, Peru, Sa<strong>in</strong>t Kitts and Nevis, Sa<strong>in</strong>t Lucia, St. V<strong>in</strong>cent and the Grenad<strong>in</strong>es, Sur<strong>in</strong>ame, Tr<strong>in</strong>idad and Tobago, Turks and Caicos, Uruguay, Venezuela (Bolivarian Republic of). 15 Includes only UNFPA programme countries, territories or other areas: Angola, Ben<strong>in</strong>, Botswana, Burk<strong>in</strong>a Faso, Burundi, Cameroon, Cape Verde, Central African Republic, Chad, Comoros, Congo, Côte d'Ivoire, Democratic Republic of the Congo, Equatorial Gu<strong>in</strong>ea, Eritrea, Ethiopia, Gabon, Gambia, Ghana, Gu<strong>in</strong>ea, Gu<strong>in</strong>ea-Bissau, Kenya, Lesotho, Liberia, Madagascar, Malawi, Mali, Mauritania, Mauritius, Mozambique, Namibia, Niger, Nigeria, Rwanda, Senegal, Seychelles, Sierra Leone, South Africa, South Sudan, Swaziland, Togo, Uganda, United Republic of Tanzania, Zambia, Zimbabwe. 16 Regional aggregations are weighted averages based on countries with available data. Technical notes Data sources and def<strong>in</strong>itions The statistical tables <strong>in</strong> The State of World Population 2013 <strong>in</strong>clude <strong>in</strong>dicators that track progress toward the goals of the Programme of Action of the International Conference on Population and Development (ICPD) and the Millennium Development Goals (MDGs) <strong>in</strong> the areas of maternal health, access to education, reproductive and sexual health. In addition, these tables <strong>in</strong>clude a variety of demographic <strong>in</strong>dicators. Different national authorities and <strong>in</strong>ternational organizations may employ different methodologies <strong>in</strong> gather<strong>in</strong>g, extrapolat<strong>in</strong>g or analyz<strong>in</strong>g data. To facilitate the <strong>in</strong>ternational comparability of data, UNFPA relies on the standard methodologies employed by the ma<strong>in</strong> sources of data, especially the Population Division of the United Nations Department of Economic and Social Affairs. In some <strong>in</strong>stances, therefore, the data <strong>in</strong> these tables differ from those generated by national authorities. Regional averages are based on data about countries and territories where UNFPA works, rather than on strict geographical def<strong>in</strong>itions employed by the Population Division of the United Nations Department of Economic and Social Affairs. For a list of countries <strong>in</strong>cluded <strong>in</strong> each regional category <strong>in</strong> this report, see the “Notes for <strong>in</strong>dicators.” Monitor<strong>in</strong>g ICPD Goals Maternal and newborn health Maternal mortality ratio, per 100,000 live births. Source: World Health Organization (WHO), UNICEF, UNFPA and World Bank. 2010. Trends <strong>in</strong> maternal mortality: 1990 to 2010: WHO. This <strong>in</strong>dicator presents the number of deaths to women per 100,000 live births which result from conditions related to pregnancy, delivery, the postpartum period, and related complications. Estimates between 100-999 are rounded to the nearest 10, and above 1,000 to the nearest 100. Several of the estimates differ from official government figures. The estimates are based on reported figures wherever possible, us<strong>in</strong>g approaches that improve the comparability of <strong>in</strong>formation from different sources. See the source for details on the orig<strong>in</strong> of particular national estimates. Estimates and methodologies are reviewed regularly by WHO, UNICEF, UNFPA, academic <strong>in</strong>stitutions and other agencies and are revised where necessary, as part of the ongo<strong>in</strong>g process of improv<strong>in</strong>g maternal mortality data. Because of changes <strong>in</strong> methods, prior estimates for 1995 and 2000 may not be strictly comparable with these estimates. Maternal mortality estimates reported here are based on the global database on maternal mortality, which is updated every 5 years. Births attended by skilled health personnel, per cent, 2005/2012. Source: WHO global database on maternal health <strong>in</strong>dicators, 2013 update. Geneva, World Health Organization (http://www.who.<strong>in</strong>t/gho). Percentage of births attended by skilled health personnel (doctors, nurses or midwives) is the percentage of deliveries attended by health personnel tra<strong>in</strong>ed <strong>in</strong> provid<strong>in</strong>g life-sav<strong>in</strong>g obstetric care, <strong>in</strong>clud<strong>in</strong>g giv<strong>in</strong>g the necessary supervision, care and advice to women dur<strong>in</strong>g pregnancy, labour and the post-partum period; conduct<strong>in</strong>g deliveries on their own; and car<strong>in</strong>g for newborns. Traditional birth attendants, even if they receive a short tra<strong>in</strong><strong>in</strong>g course, are not <strong>in</strong>cluded. Adolescent birth rate, per 1,000 women aged 15-19, 1991/2010 Source: United Nations, Department of Economic and Social Affairs, Population Division (2012). 2012 Update for the MDG Database: Adolescent Birth Rate (POP/DB/Fert/A/MDG2012). The adolescent birth rate measures the annual number of births to women 15 to 19 years of age per 1,000 women <strong>in</strong> that age group. It represents the risk THE STATE OF WORLD STATE POPULATION OF WORLD POPULATION 2013 2012 109 109
- Page 1 and 2:
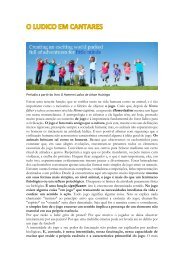
Motherhood in Childhood Facing the
- Page 3 and 4:
state of world population 2013 Moth
- Page 5 and 6:
to health. Conversely, a girl who i
- Page 7 and 8:
“I was 14… My mom and her siste
- Page 9 and 10:
access to sexual and reproductive h
- Page 11 and 12:
Research shows that addressing unin
- Page 13 and 14:
Additional efforts must be made to
- Page 15 and 16:
1 A global challenge Every year in
- Page 17 and 18:
ights, or where access to health ca
- Page 19 and 20:
According to DHS and MICS surveys,
- Page 21 and 22:
“Efforts—and resources—to pre
- Page 23 and 24:
adolescents with no education and i
- Page 25 and 26:
A UNFPA review of four countries fo
- Page 27 and 28:
Developed countries face challenges
- Page 29 and 30:
ESTIMATING ADOLESCENT PREGNANCY AND
- Page 31 and 32:
2 The impact on girls’ health, ed
- Page 33 and 34:
can increase the risk of miscarriag
- Page 35 and 36:
In sub-Saharan Africa, an estimated
- Page 37 and 38:
ADOLESCENTS, AGES 10 TO 19, LIVING
- Page 39 and 40:
community environments, she may fee
- Page 41 and 42:
effect could have added $3.4 billio
- Page 43 and 44:
suggest that between 38 per cent an
- Page 45 and 46:
3 Pressures from many directions Ad
- Page 47 and 48:
DETERMINANTS OF ADOLESCENT PREGNANC
- Page 49 and 50:
social and economic exclusion from
- Page 51 and 52:
seen as “what girls are for,” a
- Page 53 and 54:
Youth-friendly services Youth-frien
- Page 55 and 56:
An adolescent girl whose sexual par
- Page 57 and 58:
and stay in school, however, may re
- Page 59 and 60:
A study covering four African count
- Page 61 and 62:
esponsibilities of breadwinner and
- Page 63 and 64:
Child marriage does not always lead
- Page 65 and 66:
In much of Europe and North America
- Page 67 and 68:
Child, 2003; CEDAW, 1999; CRPD, Art
- Page 69 and 70:
Young people who are not living wit
- Page 71 and 72: 4 Taking action Multilevel interven
- Page 73 and 74: actions have in some way contribute
- Page 75 and 76: average household income. About 70
- Page 77 and 78: (“Open Opportunities”), establi
- Page 79 and 80: In India, Pathfinder International
- Page 81 and 82: has learned a number of lessons abo
- Page 83 and 84: change behaviour through the threat
- Page 85 and 86: contraception, through its Competit
- Page 87 and 88: and Nicaragua to strengthen the cap
- Page 89 and 90: developing gender-equitable attitud
- Page 91 and 92: eight outreach centres which offer,
- Page 93 and 94: influence gender-related attitudes
- Page 95 and 96: ehaviours of boys and girls, or inc
- Page 97 and 98: 5 Charting the way forward Adolesce
- Page 99 and 100: overlooked by policymakers and deve
- Page 101 and 102: and providing a safe environment fo
- Page 103 and 104: ©Mark Tuschman/Packard Foundation
- Page 105 and 106: great risk of injury, illness and m
- Page 107 and 108: • Registering all births and marr
- Page 109 and 110: not address social norms risk treat
- Page 111 and 112: Towards empowered adolescent girls
- Page 113 and 114: Indicators Monitoring ICPD goals: s
- Page 115 and 116: Monitoring Monitoring ICPD ICPD Goa
- Page 117 and 118: Monitoring Monitoring ICPD ICPD Goa
- Page 119 and 120: Monitoring Monitoring ICPD ICPD Goa
- Page 121: Monitoring ICPD Goals Demographic -
- Page 125 and 126: Bibliography Abdella A. et al. 2013
- Page 127 and 128: Monitoring ICPD Goals - Selected In
- Page 129 and 130: Monitoring ICPD Goals - Selected In
- Page 132: Delivering a world where every preg