- Page 2 and 3:
LANTEK TM CABLE TESTER USER’S GUI
- Page 4 and 5:
TABLE OF CONTENTS OPERATIONAL NOTES
- Page 6 and 7:
TROUBLESHOOTING 10/100/1000 BASE-T
- Page 8 and 9:
Headers and Footers Command .......
- Page 10 and 11:
OPERATIONAL NOTES, CAUTIONS, AND WA
- Page 12 and 13:
Chapter 1 Your Cable Tester PRODUCT
- Page 14 and 15:
Chapter 1 Your Cable Tester Table 1
- Page 16 and 17:
Chapter 1 Your Cable Tester Item DH
- Page 18 and 19:
Chapter 1 Your Cable Tester HARD AN
- Page 20 and 21:
Chapter 1 Your Cable Tester DISPLAY
- Page 22 and 23:
Chapter 1 Your Cable Tester OVERVIE
- Page 24 and 25:
Chapter 2 Test Setup Procedures AUT
- Page 26 and 27:
Chapter 2 Test Setup Procedures TIM
- Page 28 and 29:
Chapter 2 Test Setup Procedures Fig
- Page 30 and 31:
Chapter 2 Test Setup Procedures PAC
- Page 32 and 33:
Chapter 2 Test Setup Procedures TEM
- Page 34 and 35:
Chapter 2 Test Setup Procedures Tab
- Page 36 and 37:
Chapter 2 Test Setup Procedures Sav
- Page 38 and 39:
Chapter 2 Test Setup Procedures OTH
- Page 40 and 41:
Chapter 2 Test Setup Procedures Edi
- Page 42 and 43:
Chapter 2 Test Setup Procedures ACT
- Page 44 and 45:
Chapter 3 Structured Cable Field Ca
- Page 46 and 47:
Chapter 3 Structured Cable Field Ca
- Page 48 and 49:
Chapter 3 Structured Cable Field Ca
- Page 50 and 51:
Chapter 3 Structured Cable Field Ca
- Page 52 and 53:
Chapter 3 Structured Cable Field Ca
- Page 54 and 55:
Chapter 3 Structured Cable Field Ca
- Page 56 and 57:
Chapter 3 Structured Cable Field Ca
- Page 58 and 59:
Chapter 3 Structured Cable Field Ca
- Page 60 and 61:
Chapter 3 Structured Cable Field Ca
- Page 62 and 63:
Chapter 3 Structured Cable Field Ca
- Page 64 and 65:
Chapter 3 Structured Cable Field Ca
- Page 66 and 67:
Chapter 3 Structured Cable Field Ca
- Page 68 and 69:
Chapter 3 Structured Cable Field Ca
- Page 70 and 71:
Chapter 3 Structured Cable Field Ca
- Page 72 and 73:
Chapter 3 Structured Cable Field Ca
- Page 74 and 75:
Chapter 3 Structured Cable Field Ca
- Page 76 and 77:
Chapter 3 Structured Cable Field Ca
- Page 78 and 79:
Chapter 3 Structured Cable Field Ca
- Page 80 and 81:
Chapter 3 Structured Cable Field Ca
- Page 82 and 83: CHAPTER 4 COAX CABLE FIELD CALIBRAT
- Page 84 and 85: Chapter 4 Coax Cable Field Calibrat
- Page 86 and 87: CHAPTER 5 FIBER OPTICS CABLE FIELD
- Page 88 and 89: Chapter 5 Fiber Optics Cable Field
- Page 90 and 91: Chapter 5 Fiber Optics Cable Field
- Page 92 and 93: Chapter 5 Fiber Optics Cable Field
- Page 94 and 95: Chapter 5 Fiber Optics Cable Field
- Page 96 and 97: Chapter 5 Fiber Optics Cable Field
- Page 98 and 99: Chapter 5 Fiber Optics Cable Field
- Page 100 and 101: Chapter 6 Fiber Optics Diagnostics
- Page 102 and 103: Chapter 6 Fiber Optics Diagnostics
- Page 104 and 105: Chapter 6 Fiber Optics Diagnostics
- Page 106 and 107: Chapter 6 Fiber Optics Diagnostics
- Page 108 and 109: Chapter 6 Fiber Optics Diagnostics
- Page 110 and 111: Chapter 6 Fiber Optics Diagnostics
- Page 112 and 113: CHAPTER 7 LANTEK REPORTER SOFTWARE
- Page 114 and 115: Chapter 7 LANTEK REPORTER Software
- Page 116 and 117: Chapter 7 LANTEK REPORTER Software
- Page 118 and 119: Chapter 7 LANTEK REPORTER Software
- Page 120 and 121: Chapter 7 LANTEK REPORTER Software
- Page 122 and 123: Chapter 7 LANTEK REPORTER Software
- Page 124 and 125: Chapter 7 LANTEK REPORTER Software
- Page 126 and 127: Chapter 7 LANTEK REPORTER Software
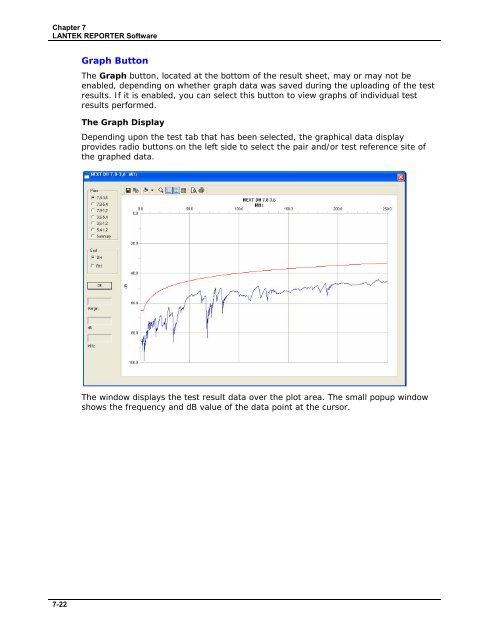
- Page 128 and 129: Chapter 7 LANTEK REPORTER Software
- Page 130 and 131: Chapter 7 LANTEK REPORTER Software
- Page 134 and 135: Chapter 7 LANTEK REPORTER Software
- Page 136 and 137: Chapter 7 LANTEK REPORTER Software
- Page 138 and 139: Chapter 7 LANTEK REPORTER Software
- Page 140 and 141: APPENDIX A SAFETY PRECAUTIONS HANDL
- Page 142 and 143: APPENDIX B CUSTOMER SUPPORT CUSTOME
- Page 144 and 145: Appendix B Customer Support IDEAL I
- Page 146 and 147: Appendix C Fiber Optic Cabling Stan