X515C DF & X510C Manual - Lowrance
X515C DF & X510C Manual - Lowrance
X515C DF & X510C Manual - Lowrance

Create successful ePaper yourself
Turn your PDF publications into a flip-book with our unique Google optimized e-Paper software.
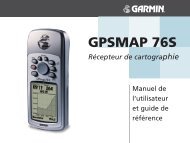
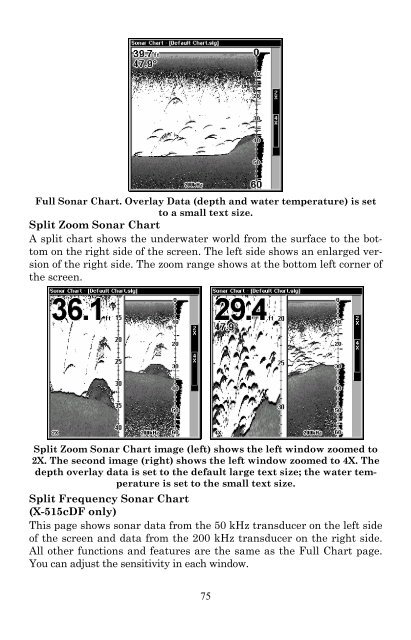
Full Sonar Chart. Overlay Data (depth and water temperature) is set<br />
to a small text size.<br />
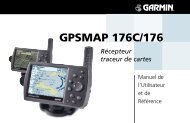
Split Zoom Sonar Chart<br />
A split chart shows the underwater world from the surface to the bottom<br />
on the right side of the screen. The left side shows an enlarged version<br />
of the right side. The zoom range shows at the bottom left corner of<br />
the screen.<br />
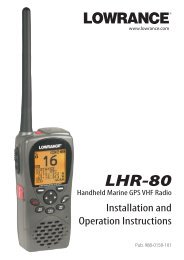
Split Zoom Sonar Chart image (left) shows the left window zoomed to<br />
2X. The second image (right) shows the left window zoomed to 4X. The<br />
depth overlay data is set to the default large text size; the water temperature<br />
is set to the small text size.<br />
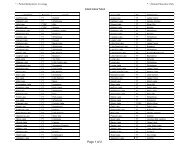
Split Frequency Sonar Chart<br />
(X-515c<strong>DF</strong> only)<br />
This page shows sonar data from the 50 kHz transducer on the left side<br />
of the screen and data from the 200 kHz transducer on the right side.<br />
All other functions and features are the same as the Full Chart page.<br />
You can adjust the sensitivity in each window.<br />
75