English version - Hexagon Composites ASA
English version - Hexagon Composites ASA
English version - Hexagon Composites ASA

Create successful ePaper yourself
Turn your PDF publications into a flip-book with our unique Google optimized e-Paper software.
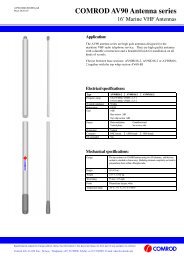
COMROD COMMUNICATION <strong>ASA</strong> – LISTING ON THE OSLO STOCK EXCHANGE<br />
COMROD’S TURNOVER BY GEOGRAPHIC MARKET 2003 - 2006<br />
(in NOK mill.) per 3Q 2006 2005 2004 2003<br />
Europe 113.1 162.5 89.0 69.9<br />
America 16.7 21.3 10.6 15.4<br />
Asia 4.9 23.9<br />
Other regions 3.1 3.5 7.2 6.4<br />
Sum revenues 137.8 211.2 106.8 91.7<br />
Note: Figures for 2003 and 2004 only include financials for Comrod AS. Figures for 2005 and 2006 are based on proforma<br />
financials for Comrod AS and Lerc SA. Power supplies included from March 2006.<br />
5.7 Patents and licences<br />
The Company does not rely on any specific patents and licenses, and the Company has not patented its<br />
product technology in general. However some special solutions are patented. The manufacturing<br />
processes apply well-known technologies combined in a number of ways to form the Company’s high<br />
quality products. The Company will always consider patents or trade marking if they believe that it is<br />
strategic right and that it will not expose the product for potential copying.<br />
As of 30 September 2006 the Company’s French subsidiary, Lerc SA, held a total of 44 patents, of, 6<br />
expires in 2008, 4 expires in 2010 and 34 expires in 2012.<br />
5.8 Research and Development<br />
The Company has brought a number of products to the market by R&D projects driven by customer<br />
requirements. The Company’s R&D work is based on multi-discipline knowledge, organizational<br />
flexibility and a close relationship to end-user needs.<br />
In addition to the above mentioned customer based R&D, the Company has developed a number of<br />
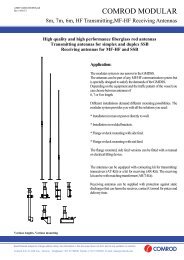
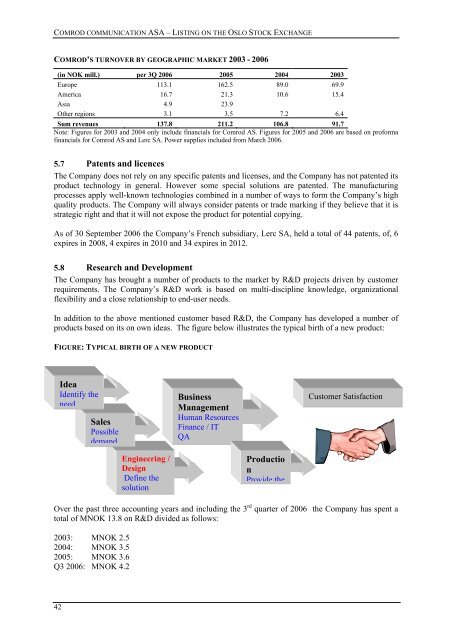
products based on its on own ideas. The figure below illustrates the typical birth of a new product:<br />
FIGURE:TYPICAL BIRTH OF A NEW PRODUCT<br />
Idea<br />
Identify the<br />
need<br />
Sales<br />
Possible<br />
demand<br />
Business<br />
Management<br />
Human Resources<br />
Finance / IT<br />
QA<br />
Customer Satisfaction<br />
Engineering /<br />
Design<br />
Define the<br />
solution<br />
Productio<br />
n<br />
Provide the<br />
Over the past three accounting years and including the 3 rd quarter of 2006 the Company has spent a<br />
total of MNOK 13.8 on R&D divided as follows:<br />
2003: MNOK 2.5<br />
2004: MNOK 3.5<br />
2005: MNOK 3.6<br />
Q3 2006: MNOK 4.2<br />
42