English version - Hexagon Composites ASA
English version - Hexagon Composites ASA
English version - Hexagon Composites ASA

You also want an ePaper? Increase the reach of your titles
YUMPU automatically turns print PDFs into web optimized ePapers that Google loves.
COMROD COMMUNICATION <strong>ASA</strong> – LISTING ON THE OSLO STOCK EXCHANGE<br />
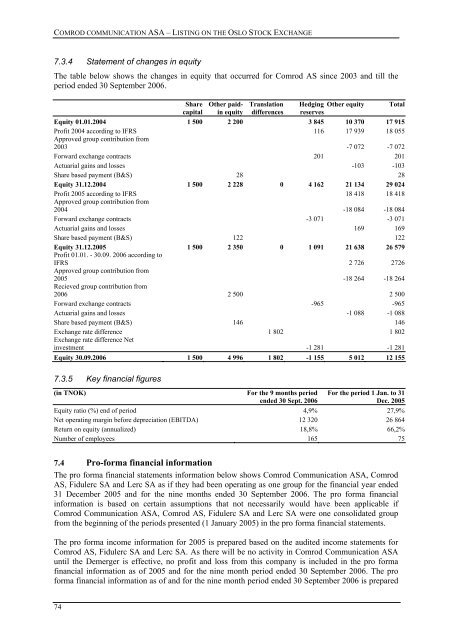
7.3.4 Statement of changes in equity<br />
The table below shows the changes in equity that occurred for Comrod AS since 2003 and till the<br />
period ended 30 September 2006.<br />
Share<br />
capital<br />
Other paidin<br />
equity<br />
Translation<br />
differences<br />
Hedging Other equity<br />
reserves<br />
Equity 01.01.2004 1 500 2 200 3 845 10 370 17 915<br />
Profit 2004 according to IFRS 116 17 939 18 055<br />
Approved group contribution from<br />
2003 -7 072 -7 072<br />
Forward exchange contracts 201 201<br />
Actuarial gains and losses -103 -103<br />
Share based payment (B&S) 28 28<br />
Equity 31.12.2004 1 500 2 228 0 4 162 21 134 29 024<br />
Profit 2005 according to IFRS 18 418 18 418<br />
Approved group contribution from<br />
2004 -18 084 -18 084<br />
Forward exchange contracts -3 071 -3 071<br />
Actuarial gains and losses 169 169<br />
Share based payment (B&S) 122 122<br />
Equity 31.12.2005 1 500 2 350 0 1 091 21 638 26 579<br />
Profit 01.01. - 30.09. 2006 according to<br />
IFRS 2 726 2726<br />
Approved group contribution from<br />
2005 -18 264 -18 264<br />
Recieved group contribution from<br />
2006 2 500 2 500<br />
Forward exchange contracts -965 -965<br />
Actuarial gains and losses -1 088 -1 088<br />
Share based payment (B&S) 146 146<br />
Exchange rate difference 1 802 1 802<br />
Exchange rate difference Net<br />
investment -1 281 -1 281<br />
Equity 30.09.2006 1 500 4 996 1 802 -1 155 5 012 12 155<br />
Total<br />
7.3.5 Key financial figures<br />
(in TNOK)<br />
For the 9 months period<br />
ended 30 Sept. 2006<br />
For the period 1 Jan. to 31<br />
Dec. 2005<br />
Equity ratio (%) end of period 4,9% 27,9%<br />
Net operating margin before depreciation (EBITDA) 12 320 26 864<br />
Return on equity (annualized) 18,8% 66,2%<br />
Number of employees 165 75<br />
7.4 Pro-forma financial information<br />
The pro forma financial statements information below shows Comrod Communication <strong>ASA</strong>, Comrod<br />
AS, Fidulerc SA and Lerc SA as if they had been operating as one group for the financial year ended<br />
31 December 2005 and for the nine months ended 30 September 2006. The pro forma financial<br />
information is based on certain assumptions that not necessarily would have been applicable if<br />
Comrod Communication <strong>ASA</strong>, Comrod AS, Fidulerc SA and Lerc SA were one consolidated group<br />
from the beginning of the periods presented (1 January 2005) in the pro forma financial statements.<br />
The pro forma income information for 2005 is prepared based on the audited income statements for<br />
Comrod AS, Fidulerc SA and Lerc SA. As there will be no activity in Comrod Communication <strong>ASA</strong><br />
until the Demerger is effective, no profit and loss from this company is included in the pro forma<br />
financial information as of 2005 and for the nine month period ended 30 September 2006. The pro<br />
forma financial information as of and for the nine month period ended 30 September 2006 is prepared<br />
74