- Page 1:
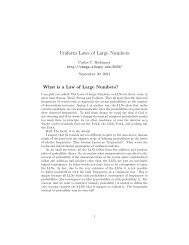
1 0.8 0.6 0.4 z 0.2 0 -0.2 -0.4 -10
- Page 4 and 5:
About the author: Michael Corral is
- Page 6 and 7:
iv Preface matter, anyone can make
- Page 8 and 9:
vi Contents 4.4 Surface Integrals a
- Page 10 and 11:
2 CHAPTER 1. VECTORS IN EUCLIDEAN S
- Page 12 and 13:
4 CHAPTER 1. VECTORS IN EUCLIDEAN S
- Page 14 and 15:
6 CHAPTER 1. VECTORS IN EUCLIDEAN S
- Page 16 and 17:
8 CHAPTER 1. VECTORS IN EUCLIDEAN S
- Page 18 and 19:
10 CHAPTER 1. VECTORS IN EUCLIDEAN
- Page 20 and 21:
12 CHAPTER 1. VECTORS IN EUCLIDEAN
- Page 22 and 23:
14 CHAPTER 1. VECTORS IN EUCLIDEAN
- Page 24 and 25:
16 CHAPTER 1. VECTORS IN EUCLIDEAN
- Page 26 and 27:
18 CHAPTER 1. VECTORS IN EUCLIDEAN
- Page 28 and 29:
20 CHAPTER 1. VECTORS IN EUCLIDEAN
- Page 30 and 31:
22 CHAPTER 1. VECTORS IN EUCLIDEAN
- Page 32 and 33:
24 CHAPTER 1. VECTORS IN EUCLIDEAN
- Page 34 and 35:
26 CHAPTER 1. VECTORS IN EUCLIDEAN
- Page 36 and 37:
28 CHAPTER 1. VECTORS IN EUCLIDEAN
- Page 38 and 39:
30 CHAPTER 1. VECTORS IN EUCLIDEAN
- Page 40 and 41:
32 CHAPTER 1. VECTORS IN EUCLIDEAN
- Page 42 and 43:
34 CHAPTER 1. VECTORS IN EUCLIDEAN
- Page 44 and 45:
36 CHAPTER 1. VECTORS IN EUCLIDEAN
- Page 46 and 47:
38 CHAPTER 1. VECTORS IN EUCLIDEAN
- Page 48 and 49:
40 CHAPTER 1. VECTORS IN EUCLIDEAN
- Page 50 and 51:
42 CHAPTER 1. VECTORS IN EUCLIDEAN
- Page 52 and 53:
44 CHAPTER 1. VECTORS IN EUCLIDEAN
- Page 54 and 55:
46 CHAPTER 1. VECTORS IN EUCLIDEAN
- Page 56 and 57:
48 CHAPTER 1. VECTORS IN EUCLIDEAN
- Page 58 and 59:
50 CHAPTER 1. VECTORS IN EUCLIDEAN
- Page 60 and 61:
52 CHAPTER 1. VECTORS IN EUCLIDEAN
- Page 62 and 63:
54 CHAPTER 1. VECTORS IN EUCLIDEAN
- Page 64 and 65:
56 CHAPTER 1. VECTORS IN EUCLIDEAN
- Page 66 and 67:
58 CHAPTER 1. VECTORS IN EUCLIDEAN
- Page 68 and 69:
60 CHAPTER 1. VECTORS IN EUCLIDEAN
- Page 70 and 71:
62 CHAPTER 1. VECTORS IN EUCLIDEAN
- Page 72 and 73:
64 CHAPTER 1. VECTORS IN EUCLIDEAN
- Page 74 and 75:
66 CHAPTER 2. FUNCTIONS OF SEVERAL
- Page 76 and 77:
68 CHAPTER 2. FUNCTIONS OF SEVERAL
- Page 78 and 79:
70 CHAPTER 2. FUNCTIONS OF SEVERAL
- Page 80 and 81:
72 CHAPTER 2. FUNCTIONS OF SEVERAL
- Page 82 and 83:
74 CHAPTER 2. FUNCTIONS OF SEVERAL
- Page 84 and 85:
76 CHAPTER 2. FUNCTIONS OF SEVERAL
- Page 86 and 87:
78 CHAPTER 2. FUNCTIONS OF SEVERAL
- Page 88 and 89:
80 CHAPTER 2. FUNCTIONS OF SEVERAL
- Page 90 and 91:
82 CHAPTER 2. FUNCTIONS OF SEVERAL
- Page 92 and 93:
84 CHAPTER 2. FUNCTIONS OF SEVERAL
- Page 94 and 95:
86 CHAPTER 2. FUNCTIONS OF SEVERAL
- Page 96 and 97:
88 CHAPTER 2. FUNCTIONS OF SEVERAL
- Page 98 and 99:
90 CHAPTER 2. FUNCTIONS OF SEVERAL
- Page 100 and 101:
92 CHAPTER 2. FUNCTIONS OF SEVERAL
- Page 102 and 103:
94 CHAPTER 2. FUNCTIONS OF SEVERAL
- Page 104 and 105:
96 CHAPTER 2. FUNCTIONS OF SEVERAL
- Page 106 and 107:
98 CHAPTER 2. FUNCTIONS OF SEVERAL
- Page 108 and 109:
100 CHAPTER 2. FUNCTIONS OF SEVERAL
- Page 110 and 111:
102 CHAPTER 3. MULTIPLE INTEGRALS T
- Page 112 and 113:
104 CHAPTER 3. MULTIPLE INTEGRALS a
- Page 114 and 115:
106 CHAPTER 3. MULTIPLE INTEGRALS l
- Page 116 and 117:
108 CHAPTER 3. MULTIPLE INTEGRALS
- Page 118 and 119:
110 CHAPTER 3. MULTIPLE INTEGRALS 3
- Page 120 and 121:
112 CHAPTER 3. MULTIPLE INTEGRALS N
- Page 122 and 123:
114 CHAPTER 3. MULTIPLE INTEGRALS w
- Page 124 and 125:
116 CHAPTER 3. MULTIPLE INTEGRALS "
- Page 126 and 127:
118 CHAPTER 3. MULTIPLE INTEGRALS a
- Page 128 and 129:
120 CHAPTER 3. MULTIPLE INTEGRALS
- Page 130 and 131:
122 CHAPTER 3. MULTIPLE INTEGRALS E
- Page 132 and 133:
124 CHAPTER 3. MULTIPLE INTEGRALS 3
- Page 134 and 135:
126 CHAPTER 3. MULTIPLE INTEGRALS T
- Page 136 and 137:
128 CHAPTER 3. MULTIPLE INTEGRALS 3
- Page 138 and 139:
130 CHAPTER 3. MULTIPLE INTEGRALS E
- Page 140 and 141:
132 CHAPTER 3. MULTIPLE INTEGRALS u
- Page 142 and 143:
134 CHAPTER 3. MULTIPLE INTEGRALS a
- Page 144 and 145:
136 CHAPTER 4. LINE AND SURFACE INT
- Page 146 and 147:
138 CHAPTER 4. LINE AND SURFACE INT
- Page 148 and 149:
140 CHAPTER 4. LINE AND SURFACE INT
- Page 150 and 151:
142 CHAPTER 4. LINE AND SURFACE INT
- Page 152 and 153:
144 CHAPTER 4. LINE AND SURFACE INT
- Page 154 and 155: 146 CHAPTER 4. LINE AND SURFACE INT
- Page 156 and 157: 148 CHAPTER 4. LINE AND SURFACE INT
- Page 158 and 159: 150 CHAPTER 4. LINE AND SURFACE INT
- Page 160 and 161: 152 CHAPTER 4. LINE AND SURFACE INT
- Page 162 and 163: 154 CHAPTER 4. LINE AND SURFACE INT
- Page 164 and 165: 156 CHAPTER 4. LINE AND SURFACE INT
- Page 166 and 167: 158 CHAPTER 4. LINE AND SURFACE INT
- Page 168 and 169: 160 CHAPTER 4. LINE AND SURFACE INT
- Page 170 and 171: 162 CHAPTER 4. LINE AND SURFACE INT
- Page 172 and 173: 164 CHAPTER 4. LINE AND SURFACE INT
- Page 174 and 175: 166 CHAPTER 4. LINE AND SURFACE INT
- Page 176 and 177: 168 CHAPTER 4. LINE AND SURFACE INT
- Page 178 and 179: 170 CHAPTER 4. LINE AND SURFACE INT
- Page 180 and 181: 172 CHAPTER 4. LINE AND SURFACE INT
- Page 182 and 183: 174 CHAPTER 4. LINE AND SURFACE INT
- Page 184 and 185: 176 CHAPTER 4. LINE AND SURFACE INT
- Page 186 and 187: 178 CHAPTER 4. LINE AND SURFACE INT
- Page 188 and 189: 180 CHAPTER 4. LINE AND SURFACE INT
- Page 190 and 191: 182 CHAPTER 4. LINE AND SURFACE INT
- Page 192 and 193: 184 CHAPTER 4. LINE AND SURFACE INT
- Page 194 and 195: 186 CHAPTER 4. LINE AND SURFACE INT
- Page 196 and 197: 188 Bibliography Pogorelov, A.V., A
- Page 198 and 199: 190 Appendix A: Answers and Hints t
- Page 200 and 201: Appendix B We will prove the right-
- Page 202 and 203: 194 Appendix B: Proof of the Right-
- Page 206 and 207: 198 Appendix C: 3D Graphing with Gn
- Page 208 and 209: 200 Appendix C: 3D Graphing with Gn
- Page 210 and 211: 202 GNU Free Documentation License
- Page 212 and 213: 204 GNU Free Documentation License
- Page 214 and 215: 206 GNU Free Documentation License
- Page 216 and 217: 208 GNU Free Documentation License
- Page 218 and 219: Index Symbols D....................
- Page 220 and 221: 212 Index iterated integral .......