Zimbabwe - Overseas Development Institute
Zimbabwe - Overseas Development Institute
Zimbabwe - Overseas Development Institute

You also want an ePaper? Increase the reach of your titles
YUMPU automatically turns print PDFs into web optimized ePapers that Google loves.
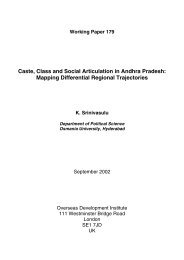
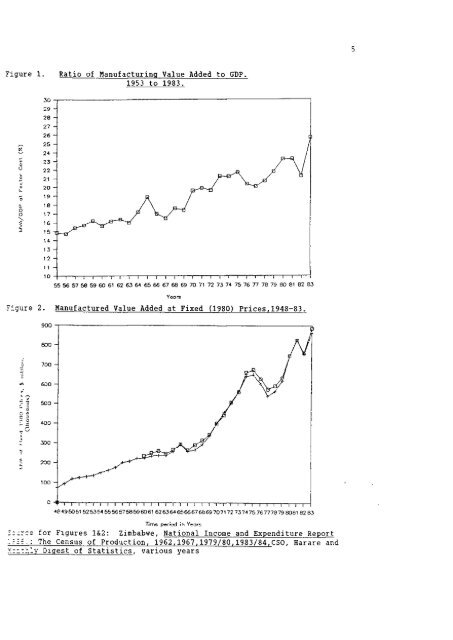
Figure 1. Ratio of Manutacturing Value Added to GDP.<br />
1953 to 1983.<br />
14 -<br />
13 -<br />
12 -<br />
I 1 -<br />
10 -|—i 1—I—I—I 1—I 1—I 1—[ 1—; 1—I 1—I 1—I 1—i—1 1—1 I I \<br />
55 56 57 66 59 60 61 62 63 64 65 66 67 68 69 70 71 72 73 74 75 76 77 78 79 80 81 82 B3<br />
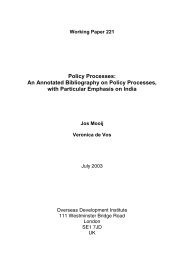
Figure 2. Manufactured Value Added at Fixed (1980) Prices,1948-83.<br />
900 -1 • — a<br />
48495051525354 55565768596061 6263646566676869707172 737475 76777879 8081 82 83<br />
Time<br />
period in Ycorr<br />
S:-rce for Figures 1&2: <strong>Zimbabwe</strong>, National Income and Expenditure Report<br />
The Census of Production, 1962,1967,1979/80,1983/84,CSO, Harare and<br />
Xriri^lv Digest of Statistics, various years