Zimbabwe - Overseas Development Institute
Zimbabwe - Overseas Development Institute
Zimbabwe - Overseas Development Institute

Create successful ePaper yourself
Turn your PDF publications into a flip-book with our unique Google optimized e-Paper software.
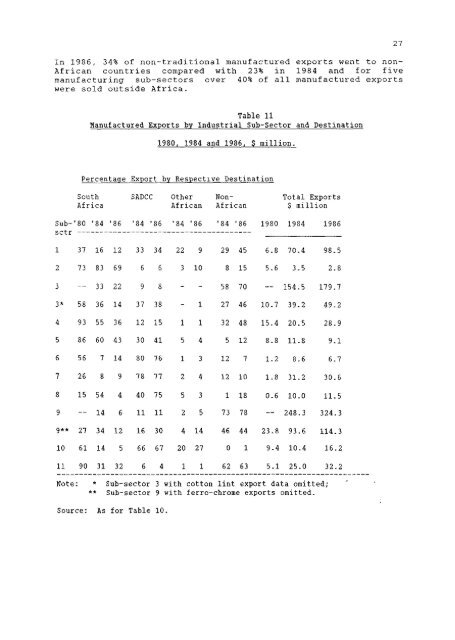
In 1986, 34% of n o n - t r a d i t i o n a l manufactured exports went to non-<br />
A f r i c a n countries compared with 23% i n 1984 and f o r f i v e<br />
manufacturing sub-sectors over 40% of a l l manufactured exports<br />
were sold outside A f r i c a .<br />
Table 11<br />
Manufactured Exports by Industrial Sub-Sector and Destination<br />
Percentage Export by Respective Destination<br />
South SADCC Other Non- Total Exports<br />
Africa African African 3 million<br />
1980, 1984 and 1986, $ million-<br />
Subsctr<br />
•80 '84 '86 '84 '86 '84 '86 '84 '86 1980 1984 1985<br />
1 37 16 12 33 34 22 9 29 45 6.8 70.4 98.5<br />
2 73 83 69 6 6 3 10 8 15 5.6 3.5 2.8<br />
3 — 33 22 9 8 - - 58 70 — 154.5 179.7<br />
3* 58 36 14 37 38 - 1 27 46 10.7 39.2 49.2<br />
4 93 55 36 12 15 1 1 32 48 15.4 20.5 28.9<br />
5 86 60 43 30 41 5 4 5 12 8.8 11.8 9.1<br />
6 56 7 14 80 76 1 3 12 7 1.2 8.6 6.7<br />
7 26 8 9 78 77 2 4 12 10 1.8 31.2 30.5<br />
8 15 54 4 40 75 5 3 1 18 0.6 10.0 11.5<br />
9 — 14 6 11 11 2 5 73 78 — 248.3 324.3<br />
9** 27 34 12 16 30 4 14 46 44 23.8 93.6 114.3<br />
10 61 14 5 66 67 20 27 0 1 9.4 10.4 16.2<br />
11 90 31 32 6 4 1 1 62 63 5.1 25.0 32.2<br />
Note : * Sub-sector 3 with cotton l i n t export data omitted;<br />
** Sub-sector 9 with ferro-chrome exports omitted.<br />
Source: As for Table 10.