Zimbabwe - Overseas Development Institute
Zimbabwe - Overseas Development Institute
Zimbabwe - Overseas Development Institute

Create successful ePaper yourself
Turn your PDF publications into a flip-book with our unique Google optimized e-Paper software.
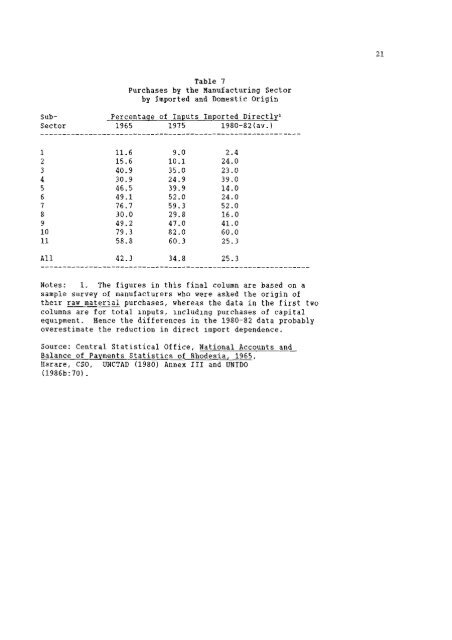
Table 7<br />
Purchases by the Manufacturing Sector<br />
by Imported and Domestic Origin<br />
Sub- Percentage of Inputs Imported Directly'<br />
Sector 1965 1975 1980-82(av.)<br />
1 11.6 9.0 2.4<br />
2 15.6 10.1 24.0<br />
3 40.9 35.0 23.0<br />
4 30.9 24.9 39.0<br />
5 46.5 39.9 14.0<br />
6 49.1 52.0 24.0<br />
7 76.7 59.3 52.0<br />
8 30.0 29.8 16.0<br />
9 49.2 47.0 41.0<br />
10 79.3 82.0 60.0<br />
11 58.8 60.3 25.3<br />
A l l 42.3 34.8 25.3<br />
Notes: 1. The figures in this final column are based on a<br />
sample survey of manufacturers who were asked the origin of<br />
their raw material purchases, whereas the data in the f i r s t two<br />
columns are for total inputs, including purchases of capital<br />
equipment. Hence the differences in the 1980-82 data probably<br />
overestimate the reduction in direct import dependence.<br />
Source: Central Statistical Office, National Accounts and<br />
Balance of Payments Statistics of Rhodesia, 1965,<br />
Harare, CSO, UNCTAD (1980) Annex III and UNIDO<br />
(1986b:70) .