Zimbabwe - Overseas Development Institute
Zimbabwe - Overseas Development Institute
Zimbabwe - Overseas Development Institute

You also want an ePaper? Increase the reach of your titles
YUMPU automatically turns print PDFs into web optimized ePapers that Google loves.
As at l e a s t part of these linkages can be analysed better by<br />
considering the input/output data between the sectors, we s h a l l<br />
now examine the evidence which e x i s t s - crude though i t i s .<br />
5.2 A g r i c u l t u r a l Inputs i n t o Manufacturing<br />
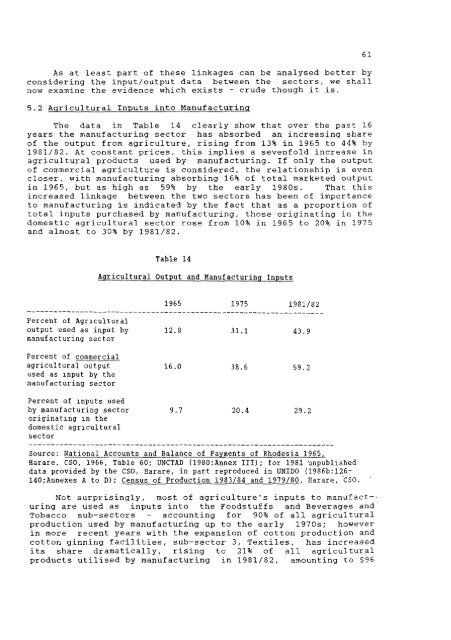
The data i n Table 14 c l e a r l y show that over the past 16<br />
years the manufacturing sector has absorbed an i n c r e a s i n g share<br />
of the output from a g r i c u l t u r e , r i s i n g from 13% i n 1965 to 44% by<br />
1981/82. At constant p r i c e s , t h i s implies a sevenfold increase i n<br />
a g r i c u l t u r a l products used by manufacturing. I f only the output<br />
of commercial a g r i c u l t u r e i s considered, the r e l a t i o n s h i p i s even<br />
c l o s e r , with manufacturing absorbing 16% of t o t a l marketed output<br />
i n 1965, but as high as 59% by the e a r l y 1980s. That t h i s<br />
increased linkage between the two sectors has been of importance<br />
to manufacturing i s i n d i c a t e d by the f a c t that as a proportion of<br />
t o t a l inputs purchased by manufacturing, those o r i g i n a t i n g i n the<br />
domestic a g r i c u l t u r a l sector rose from 10% i n 1965 to 20% i n 1975<br />
and almost to 30% by 1981/82.<br />
Table 14<br />
Agricultural Output and Manutacturing Inputs<br />
1965 1975 1981/82<br />
Percent of Agricultural<br />
output used as input by 12.8<br />
manufacturing sector<br />
31.1 43.9<br />
Percent of commercial<br />
agricultural output 16.0<br />
used as input by the<br />
manufacturing sector<br />
Percent of inputs used<br />
by manufacturing sector 9.7<br />
originating in the<br />
domestic agricultural<br />
sector<br />
38.6 59.2<br />
20.4 29.2<br />
Source: National Accounts and Balance of Payments of Rhodesia 1965,<br />
Harare, CSO, 1966, Table 60; UNCTAD (1980:Annex III); for 1981 unpublished<br />
data provided by the CSO, Harare, in part reproduced in UNIDO (1986b:126-<br />
140;Annexes A to D) ; Census of Production 1983/84 and 1979/80, Harare, CSO. '<br />
Not s u r p r i s i n g l y , most of a g r i c u l t u r e ' s inputs to manufact-'<br />
u r i n g are used as inputs i n t o the Foodstuffs and Beverages and<br />
Tobacco sub-sectors - accounting f o r 90% of a l l a g r i c u l t u r a l<br />
production used by manufacturing up to the e a r l y 1970s; however<br />
i n more recent years with the expansion of cotton production and<br />
cotton ginning f a c i l i t i e s , sub-sector 3, T e x t i l e s , has increased<br />
i t s share d r a m a t i c a l l y , r i s i n g to 21% of a l l a g r i c u l t u r a l<br />
products u t i l i s e d by manufacturing i n 1981/82, amounting to $96