Zimbabwe - Overseas Development Institute
Zimbabwe - Overseas Development Institute
Zimbabwe - Overseas Development Institute

Create successful ePaper yourself
Turn your PDF publications into a flip-book with our unique Google optimized e-Paper software.
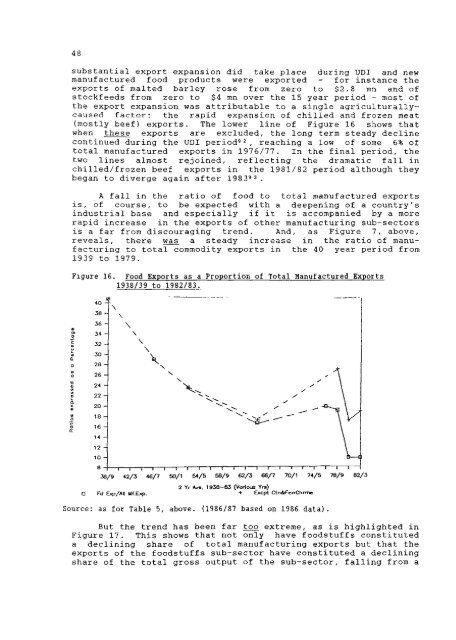
s u b s t a n t i a l export expansion d i d take place during UDI and new<br />
manufactured food products were exported - f o r instance the<br />
exports of malted barley rose from zero to $2.8 mn and of<br />
stockfeeds from zero to $4 mn over the 15 year period - most of<br />
the export expansion was a t t r i b u t a b l e to a s i n g l e a g r i c u l t u r a l l y -<br />
caused f a c t o r : the r a p i d expansion of c h i l l e d and frozen meat<br />
{mostly beef) exports. The lower l i n e of Figure 16 shows that<br />
when these exports are excluded, the long term steady d e c l i n e<br />
continued during the UDI period'^ , reaching a low of some 6% of<br />
t o t a l manufactured exports i n 1976/77. In the f i n a l period, the<br />
two l i n e s almost r e j o i n e d , r e f l e c t i n g the dramatic f a l l i n<br />
c h i l l e d / f r o z e n beef exports i n the 1981/82 period although they<br />
began to diverge again a f t e r 1983".<br />
A f a l l i n the r a t i o of food to t o t a l manufactured exports<br />
i s , of course, to be expected with a deepening of a country's<br />
i n d u s t r i a l base and e s p e c i a l l y i f i t i s accompanied by a more<br />
r a p i d increase i n the exports of other manufacturing sub-sectors<br />
i s a f a r from discouraging trend. And, as Figure 7, above,<br />
reveals, there was a steady increase i n the r a t i o of manuf<br />
a c t u r i n g to t o t a l commodity exports i n the 40 year period from<br />
1939 to 1979.<br />
Figure 16. Food Exports as a Proportion of Total Manufactured Exports<br />
1938/39 to 1982/83.<br />
38/9 42/3 46/7 50/1 S4/5 58/9 62/3 66/7 70/1 74/5 78/9 82/3<br />
2 Yr *vs. 1936-83 (Various Y)<br />
+ Excpt a Fd E>p/AII Kf.Exp. CtnifenChrmc<br />
Source: as for Table 5, above. (1986/87 based on 1986 data).<br />
But the trend has been f a r too extreme, as i s h i g h l i g h t e d i n<br />
Figure 17. This shows that not only have f o o d s t u f f s c o n s t i t u t e d<br />
a d e c l i n i n g share of t o t a l manufacturing exports but that the<br />
exports of the f o o d s t u f f s sub-sector have c o n s t i t u t e d a d e c l i n i n g<br />
share of the t o t a l gross output of the sub-sector, f a l l i n g from a