Zimbabwe - Overseas Development Institute
Zimbabwe - Overseas Development Institute
Zimbabwe - Overseas Development Institute

You also want an ePaper? Increase the reach of your titles
YUMPU automatically turns print PDFs into web optimized ePapers that Google loves.
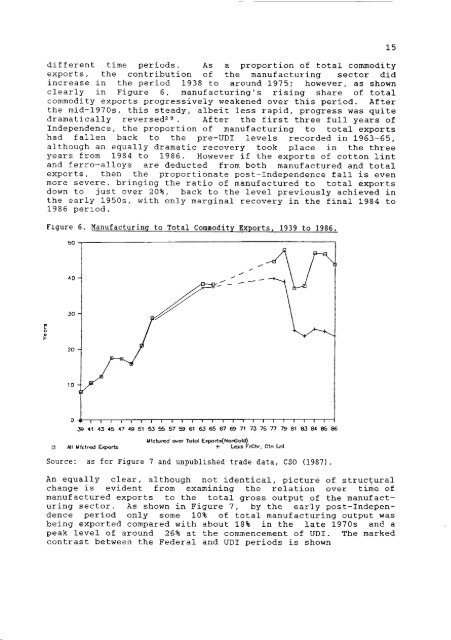
d i f f e r e n t time periods. As a proportion of t o t a l commodity<br />
exports, the c o n t r i b u t i o n of the manufacturing sector d i d<br />
increase i n the period 1938 to around 1975; however, as shown<br />
c l e a r l y i n Figure 6, manufacturing's r i s i n g share of t o t a l<br />
commodity exports p r o g r e s s i v e l y weakened over t h i s period. A f t e r<br />
the mid-1970s, t h i s steady, a l b e i t l e s s r a p i d , progress was q u i t e<br />
d r a m a t i c a l l y reversed^s. A f t e r the f i r s t three f u l l years of<br />
Independence, the proportion of manufacturing to t o t a l exports<br />
had f a l l e n back to the pre-UDI l e v e l s recorded i n 1963-65,<br />
although an equally dramatic recovery took place i n the three<br />
years from 1984 to 1986. However i f the exports of cotton l i n t<br />
and f e r r o - a l l o y s are deducted from both manufactured and t o t a l<br />
exports, then the proportionate post-Independence f a l l i s even<br />
more severe, b r i n g i n g the r a t i o of manufactured to t o t a l exports<br />
down to j u s t over 20%, back to the l e v e l p r e v i o u s l y achieved i n<br />
the e a r l y 1950s, with only marginal recovery i n the f i n a l 1984 to<br />
1986 period.<br />
Figure 6. Manufacturing to Total Commodity Exports, 1939 to 1986.<br />
50<br />
0 - i i — 1 — I — I — I — I — 1 — I — I — ) — I — I — r — I — I — I — I — I — I — 1 — I — I — I — I — I —<br />
» 41 43 45 47 49 61 53 55 57 59 61 63 65 e? 65 71 7J 75 77 79 81 83 84 85 86<br />
Mfcbjred o^a- Totol ExportoCNonGold)<br />
-f- LciS FrChr. • All Mfcired Exports: Ctn Lnt<br />
Source: as for Figure 7 and unpublished trade data, CSO (1987).<br />
An equally c l e a r , although not i d e n t i c a l , p i c t u r e of s t r u c t u r a l<br />
change i s evident from examining the r e l a t i o n over time of<br />
manufactured exports to the t o t a l gross output of the manufacturing<br />
sector. As shown i n Figure 7, by the e a r l y post-Independence<br />
period only some 10% of t o t a l manufacturing output was<br />
being exported compared with about 18% i n the l a t e 1970s and a<br />
peak l e v e l of around 26% at the commencement of UDI. The marked<br />
contrast between the Federal and UDI periods i s shown