Zimbabwe - Overseas Development Institute
Zimbabwe - Overseas Development Institute
Zimbabwe - Overseas Development Institute

You also want an ePaper? Increase the reach of your titles
YUMPU automatically turns print PDFs into web optimized ePapers that Google loves.
The s t a t i c c h a r a c t e r i s t i c s of today's manufacturing sector,<br />
shown i n Table 1, above (page 3) f a i l to capture these important<br />
features. Although the importance of sub-sector 9, Metals and<br />
Metal Products, i s i n d i c a t e d there, i t should be added that i t s<br />
p a r t i c u l a r c o n t r i b u t i o n to t o t a l MVA had already reached 17% by<br />
1960; i t rose to a peak of 32% i n 1975 and has only r e c e n t l y<br />
f a l l e n back to below 25% of t o t a l MVA. The unique development<br />
over time of the Metals and Metal Products sub-sector (9) i s<br />
shown c l e a r l y , i n Figure 23, derived from the "sources" of<br />
growth data.<br />
Comparing Figure 23 with the pattern f o r manufacturing as a<br />
whole shown i n Figure 5, above, reveals not only the dominance<br />
played by import s u b s t i t u t i o n i n contrast with domestic demand<br />
but the long term and r i s i n g s i g n i f i c a n c e of export expansion i n<br />
o v e r a l l growth.<br />
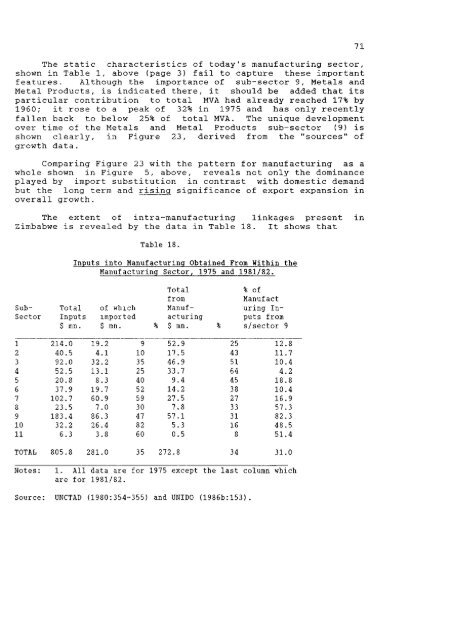
The extent of intra-manufacturing linkages present i n<br />
<strong>Zimbabwe</strong> i s revealed by the data i n Table 18. I t shows that<br />
Table 18.<br />
Inputs into Manufacturing Obtained From Within the<br />
Manufacturing Sector, 1975 and 1981/82.<br />
Total<br />
% of<br />
from<br />
Manufact<br />
Sub- Total of which Manuf uring In-<br />
Sector Inputs imported acturing puts f rom<br />
$ mn. $ mn. % $ mn. % s/sector 9<br />
1 214.0 19.2 9 52.9 25 12.8<br />
2 40.5 4.1 10 17 .5 43 11.7<br />
3 92.0 32.2 35 46 .9 51 10.4<br />
4 52.5 13.1 25 33 .7 64 4.2<br />
5 20.8 8.3 40 9 .4 45 18.8<br />
6 37.9 19.7 52 14. .2 38 10.4<br />
7 102.7 60.9 59 27, .5 27 16.9<br />
8 23.5 7.0 30 7, .8 33 57.3<br />
9 183.4 86.3 47 57, .1 31 82.3<br />
10 32.2 26.4 82 5 .3 16 48.5<br />
11 6.3 3.8 60 0, .5 8 51.4<br />
TOTAL 805.8 281.0 35 272.! i 34 31.0<br />
Notes: 1. All data are for 1975 except the last column which<br />
are for 1981/82.<br />
Source: UNCTAD (1980:354-355) and UNIDO (1986b:153).