Zimbabwe - Overseas Development Institute
Zimbabwe - Overseas Development Institute
Zimbabwe - Overseas Development Institute

Create successful ePaper yourself
Turn your PDF publications into a flip-book with our unique Google optimized e-Paper software.
The general pattern of a r i s i n g l e v e l of MVA from the e a r l y<br />
1950s to the mid-1970s, a c c e l e r a t i n g i n the decade a f t e r 1966,<br />
c o n t r a c t i o n i n the l a t e 1970s and renewed, i f l e s s s t a b l e ,<br />
expansion t h e r e a f t e r for the manufacturing sector as a wholeshown<br />
i n Figure 2, above - has broadly been repeated for the<br />
d i f f e r e n t sub-sectors of i n d u s t r y . The annual changes i n MVA by<br />
sub-sector over a 20 year period reveal more v o l a t i l e s h i f t s i n<br />
r e a l MVA trends than the o v e r a l l average f o r sub-sectors (3), (8)<br />
and (10), while sub-sectors (1) and (2) recorded a more steady<br />
secular r i s e with no c o n t r a c t i o n i n the p e r i o d of the l a t e<br />
1970s"'. Figure 11 shows that, i n terms of MVA per c a p i t a , the<br />
trend over the past 25 years has also been s t e a d i l y upwards,<br />
again with accelerated growth i n the decade a f t e r UDI. For the<br />
sub-sectoral brealcdown, the o v e r a l l secular increase i s repeated<br />
for a l l but two sub-sectors: consistent with previous observations,<br />
the poorest performance occurred i n sub-sectors (6) and<br />
(10) with sub-sectors (5) and (7) experiencing the widest<br />
f l u c t u a t i o n s around the r i s i n g trend.<br />
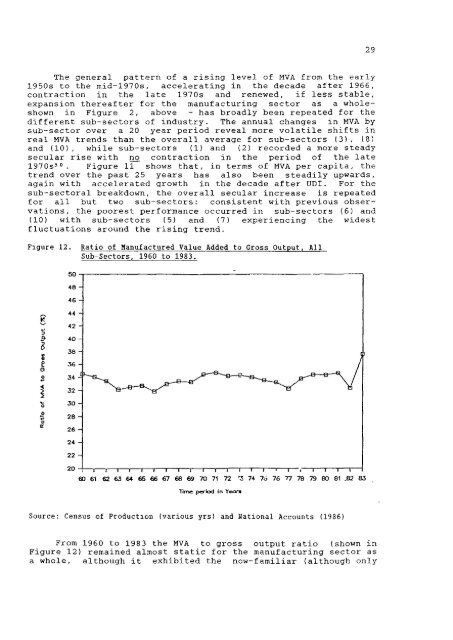
Figure 12. Ratio of Manufactured Value Added to Gross Output, A l l<br />
Sub-Sectors, 1960 to 1983.<br />
e<br />
o<br />
60 61 62 63 6+ 65 66 67 68 69 70 71 72<br />
1 — T — I — • 1—-1 1 — I — I — r<br />
'3 74 7a 76 T7 78 79 80 81 .82 83<br />
Time period in Yeara<br />
Source: Census of Production (various yrs) and national Accounts (1986)<br />
From 1960 to 1983 the MVA to gross output r a t i o (shown i n<br />
Figure 12) remained almost s t a t i c f o r the manufacturing sector as<br />
a whole, although i t e x h i b i t e d the now-familiar (although only