Zimbabwe - Overseas Development Institute
Zimbabwe - Overseas Development Institute
Zimbabwe - Overseas Development Institute

Create successful ePaper yourself
Turn your PDF publications into a flip-book with our unique Google optimized e-Paper software.
f e r r o - a l l o y s and s t e e l exports. A d d i t i o n a l l y , the f i g u r e s also<br />
show that by 1985/86 as a proportion of t o t a l commodity exports,<br />
manufactured exports had begun to regain t h e i r pre-Independence<br />
share, although, again, the 1986 f i g u r e s i n d i c a t e that the gains<br />
made i n 1984 and 1985 were not sustained i n t o 19863 1. I n i t i a l<br />
evidence f o r 1987 reveals that manufacturing exports continued to<br />
expand f o r c l o t h i n g and footwear (57% increase over 1986),<br />
t e x t i l e s (32% increase), f o o d s t u f f s , drink and tobacco, nonm<br />
e t a l l i c minerals and c u r i o and leather products. For sub-sector<br />
10, however, exports are estinmated to have contracted by 30% i n<br />
r e l a t i o n to 1986 l e v e l s ^ ^ .<br />
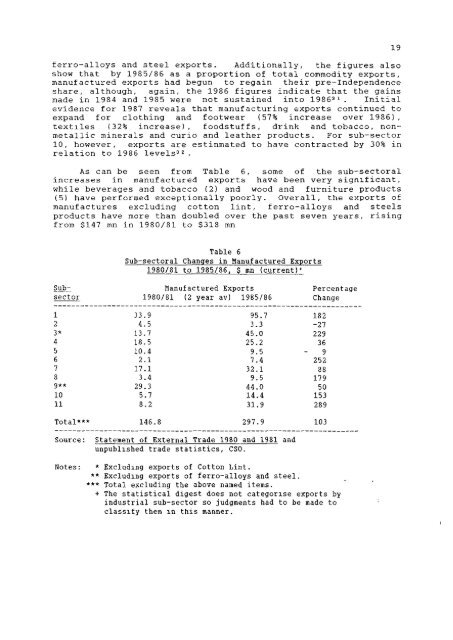
As can be seen from Table 6, some of the sub-sectoral<br />
increases i n manufactured exports have been very s i g n i f i c a n t ,<br />
while beverages and tobacco (2) and wood and f u r n i t u r e products<br />
(5) have performed e x c e p t i o n a l l y poorly. O v e r a l l , the exports of<br />
manufactures excluding cotton l i n t , f e r r o - a l l o y s and s t e e l s<br />
products have more than doubled over the past seven years, r i s i n g<br />
from $147 mn i n 1980/81 to $318 mn<br />
Table 6<br />
Sub-sectoral Changes in Manufactured Exports<br />
1980/81 to 1985/86, S mn (current)*<br />
Sub- Manufactured Exports Percentage<br />
sector 1980/81 (2 year av) 1985/86 Change<br />
1 33.9 95.7 182<br />
2 4.5 3.3 -27<br />
3* 13.7 45.0 229<br />
4 18.5 25.2 36<br />
5 10.4 9.5 9<br />
6 2.1 7.4 252<br />
7 17.1 32.1 88<br />
8 3.4 9.5 179<br />
9** 29.3 44.0 50<br />
10 5.7 14.4 153<br />
11 8.2 31.9 289<br />
Total*** 146.8 297.9 103<br />
Source: Statement of External Trade 1980 and 1981 and<br />
unpublished trade statistics, CSO.<br />
Notes: * Excluding exports of Cotton Lint.<br />
** Excluding exports of ferro-alloys and steel.<br />
*** Total excluding the above named items.<br />
+ The s t a t i s t i c a l digest does not categorise exports by<br />
industrial sub-sector so judgments had to be made to<br />
classify them in this manner.