annual report 2011â12 - Parliament of New South Wales - NSW ...
annual report 2011â12 - Parliament of New South Wales - NSW ...
annual report 2011â12 - Parliament of New South Wales - NSW ...

You also want an ePaper? Increase the reach of your titles
YUMPU automatically turns print PDFs into web optimized ePapers that Google loves.
Department <strong>of</strong> Transport<br />
Notes to the financial statements<br />
for the year ended 30 June 2012<br />
32 FINANCIAL INSTRUMENTS (cont'd)<br />
(d)<br />
Market risk<br />
Market risk relates to fluctuations in the fair value <strong>of</strong> future cash flows <strong>of</strong> financial instruments because <strong>of</strong> changes in<br />
market prices. This applies to the <strong>report</strong>ing entity’s foreign exchange, interest rate and commodity price hedging<br />
instruments.<br />
Sensitivity analysis on market risk is based on a reasonably possible price variability taking into account the<br />
economic environment in which the <strong>report</strong>ing entity’s operates and the time frame for assessment, that is, until the<br />
end <strong>of</strong> the next <strong>report</strong>ing period. The sensitivity analysis is based on financial instruments held at the balance date.<br />
The analysis assumes that all other variables remain constant.<br />
The effect on pr<strong>of</strong>it and equity due to a reasonably possible change in risk variable is outlined in the information<br />
provided below, for interest rate risk and other price risk including currency movements. A reasonably possible<br />
change in risk variable has been determined after taking into account the economic environment in which the<br />
<strong>report</strong>ing entity operates and the time frame for the assessment (i.e. until the end <strong>of</strong> the next <strong>annual</strong> <strong>report</strong>ing period).<br />
The sensitivity analysis is based on risk exposures in existence at the balance date. The analysis is performed on the<br />
same basis for 2010 and assumes that all other variables remain constant.<br />
The <strong>report</strong>ing entity is exposed to market risks in respective <strong>of</strong><br />
(i)<br />
Interest rate risk<br />
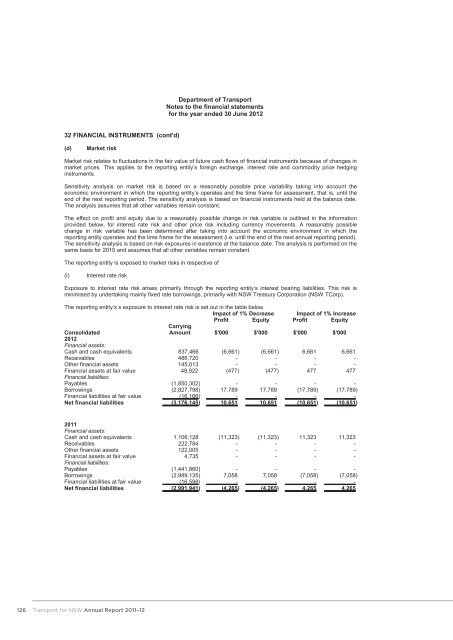
Exposure to interest rate risk arises primarily through the <strong>report</strong>ing entity’s interest bearing liabilities. This risk is<br />
minimised by undertaking mainly fixed rate borrowings, primarily with <strong>NSW</strong> Treasury Corporation (<strong>NSW</strong> TCorp).<br />
The <strong>report</strong>ing entity’s s exposure to interest rate risk is set out in the table below.<br />
Impact <strong>of</strong> 1% Decrease Impact <strong>of</strong> 1% Increase<br />
Pr<strong>of</strong>it Equity Pr<strong>of</strong>it Equity<br />
Consolidated<br />
Carrying<br />
Amount $'000 $'000 $'000 $'000<br />
2012<br />
Financial assets:<br />
Cash and cash equivalents 837,466 (6,661) (6,661) 6,661 6,661<br />
Receivables 486,720 - - - -<br />
Other financial assets 145,013 - - - -<br />
Financial assets at fair value 48,922 (477) (477) 477 477<br />
Financial liabilities:<br />
Payables (1,850,302) - - - -<br />
Borrowings (2,827,798) 17,789 17,789 (17,789) (17,789)<br />
Financial liabilities at fair value (16,166) - - - -<br />
Net financial liabilities (3,176,145) 10,651 10,651 (10,651) (10,651)<br />
2011<br />
Financial assets:<br />
Cash and cash equivalents 1,106,128 (11,323) (11,323) 11,323 11,323<br />
Receivables 222,784 - - - -<br />
Other financial assets 122,005 - - - -<br />
Financial assets at fair value 4,735 - - - -<br />
Financial liabilities:<br />
Payables (1,441,860) - - - -<br />
Borrowings (2,989,135) 7,058 7,058 (7,058) (7,058)<br />
Financial liabilities at fair value (16,598) - - - -<br />
Net financial liabilities (2,991,941) (4,265) (4,265) 4,265 4,265<br />
126<br />
Transport for <strong>NSW</strong> Annual Report 2011–12