annual report 2011â12 - Parliament of New South Wales - NSW ...
annual report 2011â12 - Parliament of New South Wales - NSW ...
annual report 2011â12 - Parliament of New South Wales - NSW ...

Create successful ePaper yourself
Turn your PDF publications into a flip-book with our unique Google optimized e-Paper software.
Department <strong>of</strong> Transport<br />
Notes to the financial statements<br />
for the year ended 30 June 2012<br />
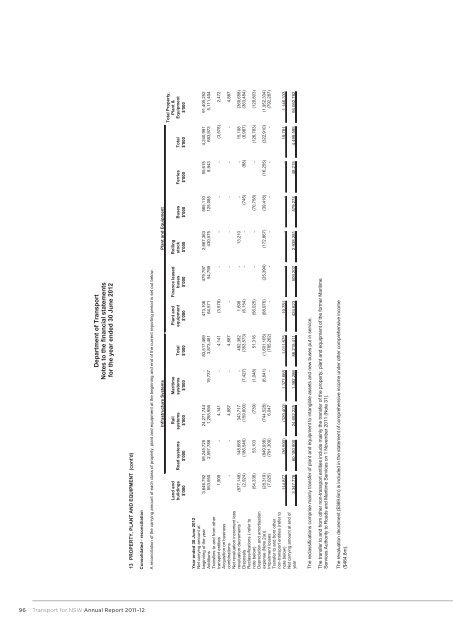
13 PROPERTY, PLANT AND EQUIPMENT (cont'd)<br />
Consolidated - reconciliation<br />
A reconciliation <strong>of</strong> the carrying amount <strong>of</strong> each class <strong>of</strong> property, plant and equipment at the beginning and end <strong>of</strong> the current <strong>report</strong>ing period is set out below.<br />
Land and<br />
buildings Road systems<br />
Infrastructure Systems Plant and Equipment<br />
Rail<br />
systems<br />
Maritime<br />
systems Total<br />
Plant and<br />
equipment<br />
Finance leased<br />
buses<br />
Rolling<br />
stock Buses Ferries Total<br />
Total Property,<br />
Plant &<br />
Equipment<br />
$'000 $'000 $'000 $'000 $'000 $'000 $'000 $'000 $'000 $'000 $'000 $'000<br />
Year ended 30 June 2012<br />
Net carrying amount at<br />
beginning <strong>of</strong> the year 3,646,792 59,245,725 24,271,744 - 83,517,469 473,106 479,797 2,667,363 565,110 55,615 4,240,991 91,405,252<br />
Additions 553,950 2,597,788 1,255,956 19,737 3,873,481 64,571 54,799 430,575 125,085 8,943 683,973 5,111,404<br />
Transfers to and from other<br />
transport entities 1,909 - 4,141 - 4,141 (3,578) - - - - (3,578) 2,472<br />
Acquisition on business<br />
combinations - - 4,887 - 4,887 - - - - - - 4,887<br />
Net revaluation increment less<br />
revaluation decrements * (877,148) 148,665 343,717 - 492,382 1,898 - 13,210 - - 15,108 (369,658)<br />
Disposals (2,924) (186,546) (159,600) (7,427) (353,573) (6,154) - - (745) (88) (6,987) (363,484)<br />
Reclassifications ( refer to<br />
note below) (54,336) 53,103 (739) (1,048) 51,316 (56,025) - - (70,758) - (126,783) (129,803)<br />
Depreciation and amortisation<br />
expense (Note 2(e)) (28,319) (849,936) (744,528) (6,641) (1,601,105) (68,976) (25,394) (172,867) (39,418) (16,255) (322,910) (1,952,334)<br />
Impairment losses (7,025) (791,309) 6,047 - (785,262) - - - - - - (792,287)<br />
Transfer to and from other<br />
non-transport entities (refer to<br />
note below) 114,877 (36,590) (329,400) 1,377,665 1,011,675 19,781 - - - - 19,781 1,146,333<br />
Net carrying amount at end <strong>of</strong><br />
year 3,347,776 60,180,900 24,652,225 1,382,286 86,215,411 424,623 509,202 2,938,281 579,274 48,215 4,499,595 94,062,782<br />
The reclassifications comprise mainly transfer <strong>of</strong> plant and equipment to intangible assets and new buses put in service.<br />
The transfer to and from other non-transport entities include mainly the transfer <strong>of</strong> the property, plant and equipment <strong>of</strong> the former Maritime<br />
Services Authority to Roads and Maritime Services on 1 November 2011 (Note 31).<br />
The revaluation decrement ($369.6m) is included in the statement <strong>of</strong> comprehensive income under other comprehensive income<br />
($464.8m).<br />
96<br />
Transport for <strong>NSW</strong> Annual Report 2011–12