annual report 2011â12 - Parliament of New South Wales - NSW ...
annual report 2011â12 - Parliament of New South Wales - NSW ...
annual report 2011â12 - Parliament of New South Wales - NSW ...

You also want an ePaper? Increase the reach of your titles
YUMPU automatically turns print PDFs into web optimized ePapers that Google loves.
Movement in salaries, wages<br />
and allowances<br />
Staff employed under the provisions<br />
<strong>of</strong> the Transport Service <strong>of</strong><br />
<strong>New</strong> <strong>South</strong> <strong>Wales</strong> Salaries and<br />
Conditions <strong>of</strong> Employment Award<br />
2011 were entitled to a 2.5 per<br />
cent increase in remuneration<br />
effective from 1 July 2011.<br />
Industrial Relations<br />
Commission<br />
During the <strong>report</strong>ing period<br />
there were two industrial<br />
disputes notified to the Industrial<br />
Commission <strong>of</strong> <strong>NSW</strong>. Neither<br />
dispute involved any bans,<br />
limitations or stoppage <strong>of</strong> work.<br />
Appendix 18: Equal Employment Opportunity (EEO)<br />
The Equal Employment<br />
Opportunity information <strong>report</strong>ed<br />
for 2011-12 for the Department<br />
<strong>of</strong> Transport (full year period)<br />
and Tf<strong>NSW</strong> (1 November 2011 –<br />
30 June 2012 only) is affected<br />
by two significant factors.<br />
There was a large transfer <strong>of</strong><br />
staff from the Department <strong>of</strong><br />
Transport to Tf<strong>NSW</strong> during the<br />
year, with very few intakes, while<br />
Tf<strong>NSW</strong>’s pr<strong>of</strong>ile was affected by<br />
it being a new organisation.<br />
It is expected that a more<br />
consistent pr<strong>of</strong>ile <strong>of</strong> EEO within<br />
Tf<strong>NSW</strong> will be <strong>report</strong>ed in<br />
the 2012-13 <strong>annual</strong> <strong>report</strong>.<br />
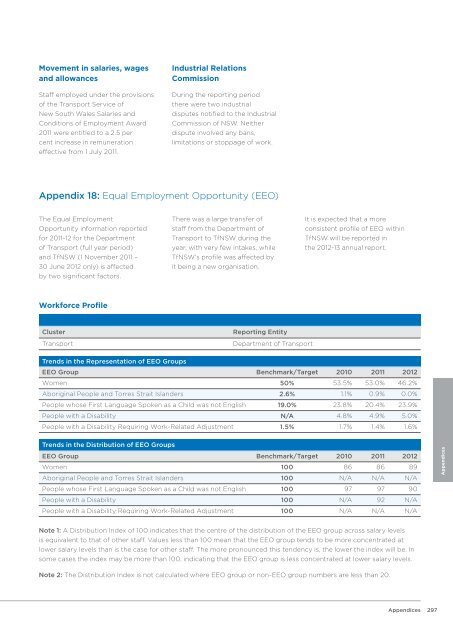
Workforce Pr<strong>of</strong>ile<br />
Cluster<br />
Reporting Entity<br />
Transport<br />
Department <strong>of</strong> Transport<br />
Trends in the Representation <strong>of</strong> EEO Groups<br />
EEO Group Benchmark/Target 2010 2011 2012<br />
Women 50% 53.5% 53.0% 46.2%<br />
Aboriginal People and Torres Strait Islanders 2.6% 1.1% 0.9% 0.0%<br />
People whose First Language Spoken as a Child was not English 19.0% 23.8% 20.4% 23.9%<br />
People with a Disability N/A 4.8% 4.9% 5.0%<br />
People with a Disability Requiring Work-Related Adjustment 1.5% 1.7% 1.4% 1.6%<br />
Trends in the Distribution <strong>of</strong> EEO Groups<br />
EEO Group Benchmark/Target 2010 2011 2012<br />
Women 100 86 86 89<br />
Aboriginal People and Torres Strait Islanders 100 N/A N/A N/A<br />
People whose First Language Spoken as a Child was not English 100 97 97 90<br />
People with a Disability 100 N/A 92 N/A<br />
People with a Disability Requiring Work-Related Adjustment 100 N/A N/A N/A<br />
Appendices<br />
Note 1: A Distribution Index <strong>of</strong> 100 indicates that the centre <strong>of</strong> the distribution <strong>of</strong> the EEO group across salary levels<br />
is equivalent to that <strong>of</strong> other staff. Values less than 100 mean that the EEO group tends to be more concentrated at<br />
lower salary levels than is the case for other staff. The more pronounced this tendency is, the lower the index will be. In<br />
some cases the index may be more than 100, indicating that the EEO group is less concentrated at lower salary levels.<br />
Note 2: The Distribution Index is not calculated where EEO group or non-EEO group numbers are less than 20.<br />
Appendices<br />
297