annual report 2011â12 - Parliament of New South Wales - NSW ...
annual report 2011â12 - Parliament of New South Wales - NSW ...
annual report 2011â12 - Parliament of New South Wales - NSW ...

Create successful ePaper yourself
Turn your PDF publications into a flip-book with our unique Google optimized e-Paper software.
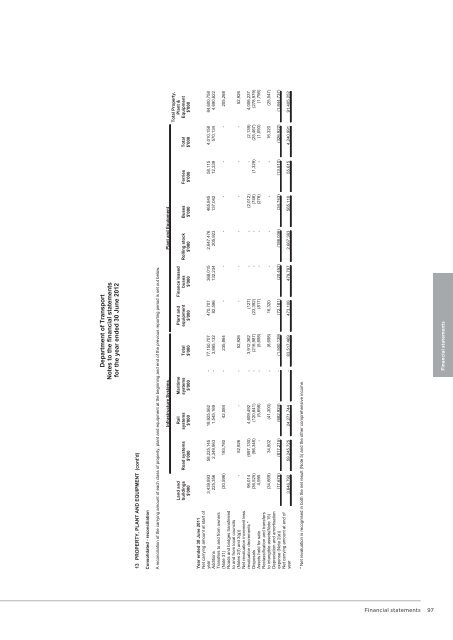
Department <strong>of</strong> Transport<br />
Notes to the financial statements<br />
for the year ended 30 June 2012<br />
13 PROPERTY, PLANT AND EQUIPMENT (cont'd)<br />
Consolidated - reconciliation<br />
A reconciliation <strong>of</strong> the carrying amount <strong>of</strong> each class <strong>of</strong> property, plant and equipment at the beginning and end <strong>of</strong> the previous <strong>report</strong>ing period is set out below.<br />
Land and<br />
buildings Road systems<br />
Infrastructure Systems Plant and Equipment<br />
Rail<br />
systems<br />
Maritime<br />
systems Total<br />
Plant and<br />
equipment<br />
Finance leased<br />
buses Rolling stock Buses Ferries Total<br />
Total Property,<br />
Plant &<br />
Equipment<br />
$'000 $'000 $'000 $'000 $'000 $'000 $'000 $'000 $'000 $'000 $'000 $'000<br />
Year ended 30 June 2011<br />
Net carrying amount at start <strong>of</strong><br />
year 3,439,893 58,225,145 18,925,562 - 77,150,707 470,707 368,015 2,647,476 465,845 58,115 4,010,158 84,600,758<br />
Additions 225,356 2,349,963 1,545,169 - 3,895,132 82,596 132,234 205,923 137,042 12,339 570,134 4,690,622<br />
Transfers to and from owners<br />
(Note 31) (30,596) 193,780 42,084 - 235,864 - - - - - - 205,268<br />
Roads and bridges transferred<br />
to and from local councils<br />
(Notes 2(f) and 3(g)) - 52,926 - - 52,926 - - - - - - 52,926<br />
Net revaluation increment less<br />
revaluation decrements * 96,014 (697,130) 4,609,492 - 3,912,362 (127) - - (2,012) - (2,139) 4,006,237<br />
Disposals (36,525) (96,346) (120,641) - (216,987) (23,392) - - (746) (1,329) (25,467) (278,979)<br />
Assets held for sale 4,995 - (5,698) - (5,698) (817) - - (276) - (1,093) (1,796)<br />
Reclassification and transfers<br />
to intangible assets(Note 15) (34,669) 34,602 (41,300) - (6,698) 16,320 - - - - 16,320 (25,047)<br />
Depreciation and amortisation<br />
expense (Note 2(e)) (17,676) (817,215) (682,924) - (1,500,139) (72,181) (20,452) (186,036) (34,743) (13,510) (326,922) (1,844,737)<br />
Net carrying amount at end <strong>of</strong><br />
year 3,646,792 59,245,725 24,271,744 - 83,517,469 473,106 479,797 2,667,363 565,110 55,615 4,240,991 91,405,252<br />
* Net revaluation is recognised in both the net result (Note 5) and the other comprehensive income.<br />
Financial statements<br />
Financial statements<br />
97