Labour Market Forum 2010 - Planning Institute of Jamaica
Labour Market Forum 2010 - Planning Institute of Jamaica
Labour Market Forum 2010 - Planning Institute of Jamaica

You also want an ePaper? Increase the reach of your titles
YUMPU automatically turns print PDFs into web optimized ePapers that Google loves.
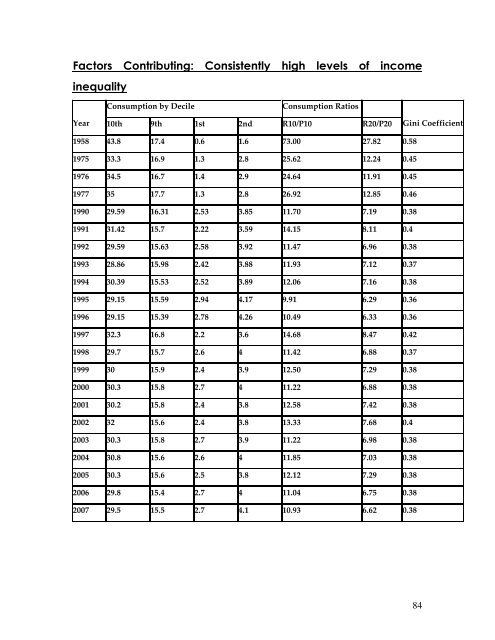
Factors Contributing: Consistently high levels <strong>of</strong> income<br />
inequality<br />
Consumption by Decile<br />
Consumption Ratios<br />
Year 10th 9th 1st 2nd R10/P10 R20/P20 Gini Coefficient<br />
1958 43.8 17.4 0.6 1.6 73.00 27.82 0.58<br />
1975 33.3 16.9 1.3 2.8 25.62 12.24 0.45<br />
1976 34.5 16.7 1.4 2.9 24.64 11.91 0.45<br />
1977 35 17.7 1.3 2.8 26.92 12.85 0.46<br />
1990 29.59 16.31 2.53 3.85 11.70 7.19 0.38<br />
1991 31.42 15.7 2.22 3.59 14.15 8.11 0.4<br />
1992 29.59 15.63 2.58 3.92 11.47 6.96 0.38<br />
1993 28.86 15.98 2.42 3.88 11.93 7.12 0.37<br />
1994 30.39 15.53 2.52 3.89 12.06 7.16 0.38<br />
1995 29.15 15.59 2.94 4.17 9.91 6.29 0.36<br />
1996 29.15 15.39 2.78 4.26 10.49 6.33 0.36<br />
1997 32.3 16.8 2.2 3.6 14.68 8.47 0.42<br />
1998 29.7 15.7 2.6 4 11.42 6.88 0.37<br />
1999 30 15.9 2.4 3.9 12.50 7.29 0.38<br />
2000 30.3 15.8 2.7 4 11.22 6.88 0.38<br />
2001 30.2 15.8 2.4 3.8 12.58 7.42 0.38<br />
2002 32 15.6 2.4 3.8 13.33 7.68 0.4<br />
2003 30.3 15.8 2.7 3.9 11.22 6.98 0.38<br />
2004 30.8 15.6 2.6 4 11.85 7.03 0.38<br />
2005 30.3 15.6 2.5 3.8 12.12 7.29 0.38<br />
2006 29.8 15.4 2.7 4 11.04 6.75 0.38<br />
2007 29.5 15.5 2.7 4.1 10.93 6.62 0.38<br />
84