

Comprehensive Annual Financial Report - City of Santa Monica
Comprehensive Annual Financial Report - City of Santa Monica
Comprehensive Annual Financial Report - City of Santa Monica

You also want an ePaper? Increase the reach of your titles
YUMPU automatically turns print PDFs into web optimized ePapers that Google loves.
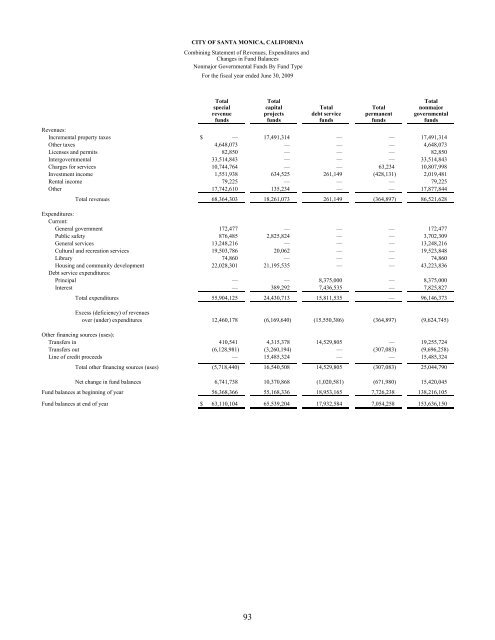
CITY OF SANTA MONICA, CALIFORNIA<br />
Combining Statement <strong>of</strong> Revenues, Expenditures and<br />
Changes in Fund Balances<br />
Nonmajor Governmental Funds By Fund Type<br />
For the fiscal year ended June 30, 2009<br />
Total Total Total<br />
special capital Total Total nonmajor<br />
revenue projects debt service permanent governmental<br />
funds funds funds funds funds<br />
Revenues:<br />
Incremental property taxes $ — 17,491,314 — — 17,491,314<br />
Other taxes 4,648,073 — — — 4,648,073<br />
Licenses and permits 82,850 — — — 82,850<br />
Intergovernmental 33,514,843 — — — 33,514,843<br />
Charges for services 10,744,764 — — 63,234 10,807,998<br />
Investment income 1,551,938 634,525 261,149 (428,131) 2,019,481<br />
Rental income 79,225 — — — 79,225<br />
Other 17,742,610 135,234 — — 17,877,844<br />
Total revenues 68,364,303 18,261,073 261,149 (364,897) 86,521,628<br />
Expenditures:<br />
Current:<br />
General government 172,477 — — — 172,477<br />
Public safety 876,485 2,825,824 — — 3,702,309<br />
General services 13,248,216 — — — 13,248,216<br />
Cultural and recreation services 19,503,786 20,062 — — 19,523,848<br />
Library 74,860 — — — 74,860<br />
Housing and community development 22,028,301 21,195,535 — — 43,223,836<br />
Debt service expenditures:<br />
Principal — — 8,375,000 — 8,375,000<br />
Interest — 389,292 7,436,535 — 7,825,827<br />
Total expenditures 55,904,125 24,430,713 15,811,535 — 96,146,373<br />
Excess (deficiency) <strong>of</strong> revenues<br />
over (under) expenditures 12,460,178 (6,169,640) (15,550,386) (364,897) (9,624,745)<br />
Other financing sources (uses):<br />
Transfers in 410,541 4,315,378 14,529,805 — 19,255,724<br />
Transfers out (6,128,981) (3,260,194) — (307,083) (9,696,258)<br />
Line <strong>of</strong> credit proceeds — 15,485,324 — — 15,485,324<br />
Total other financing sources (uses) (5,718,440) 16,540,508 14,529,805 (307,083) 25,044,790<br />
Net change in fund balances 6,741,738 10,370,868 (1,020,581) (671,980) 15,420,045<br />
Fund balances at beginning <strong>of</strong> year 56,368,366 55,168,336 18,953,165 7,726,238 138,216,105<br />
Fund balances at end <strong>of</strong> year $ 63,110,104 65,539,204 17,932,584 7,054,258 153,636,150<br />
93


